Text Search
The Text search chart is a visual filtering tool that shows the text searches as a table. In this tutorial, we will guide you through the process of utilizing the text search chart.
Creating a Text Search Chart
Select Text search from the list of Text Widgets in the widget menu.

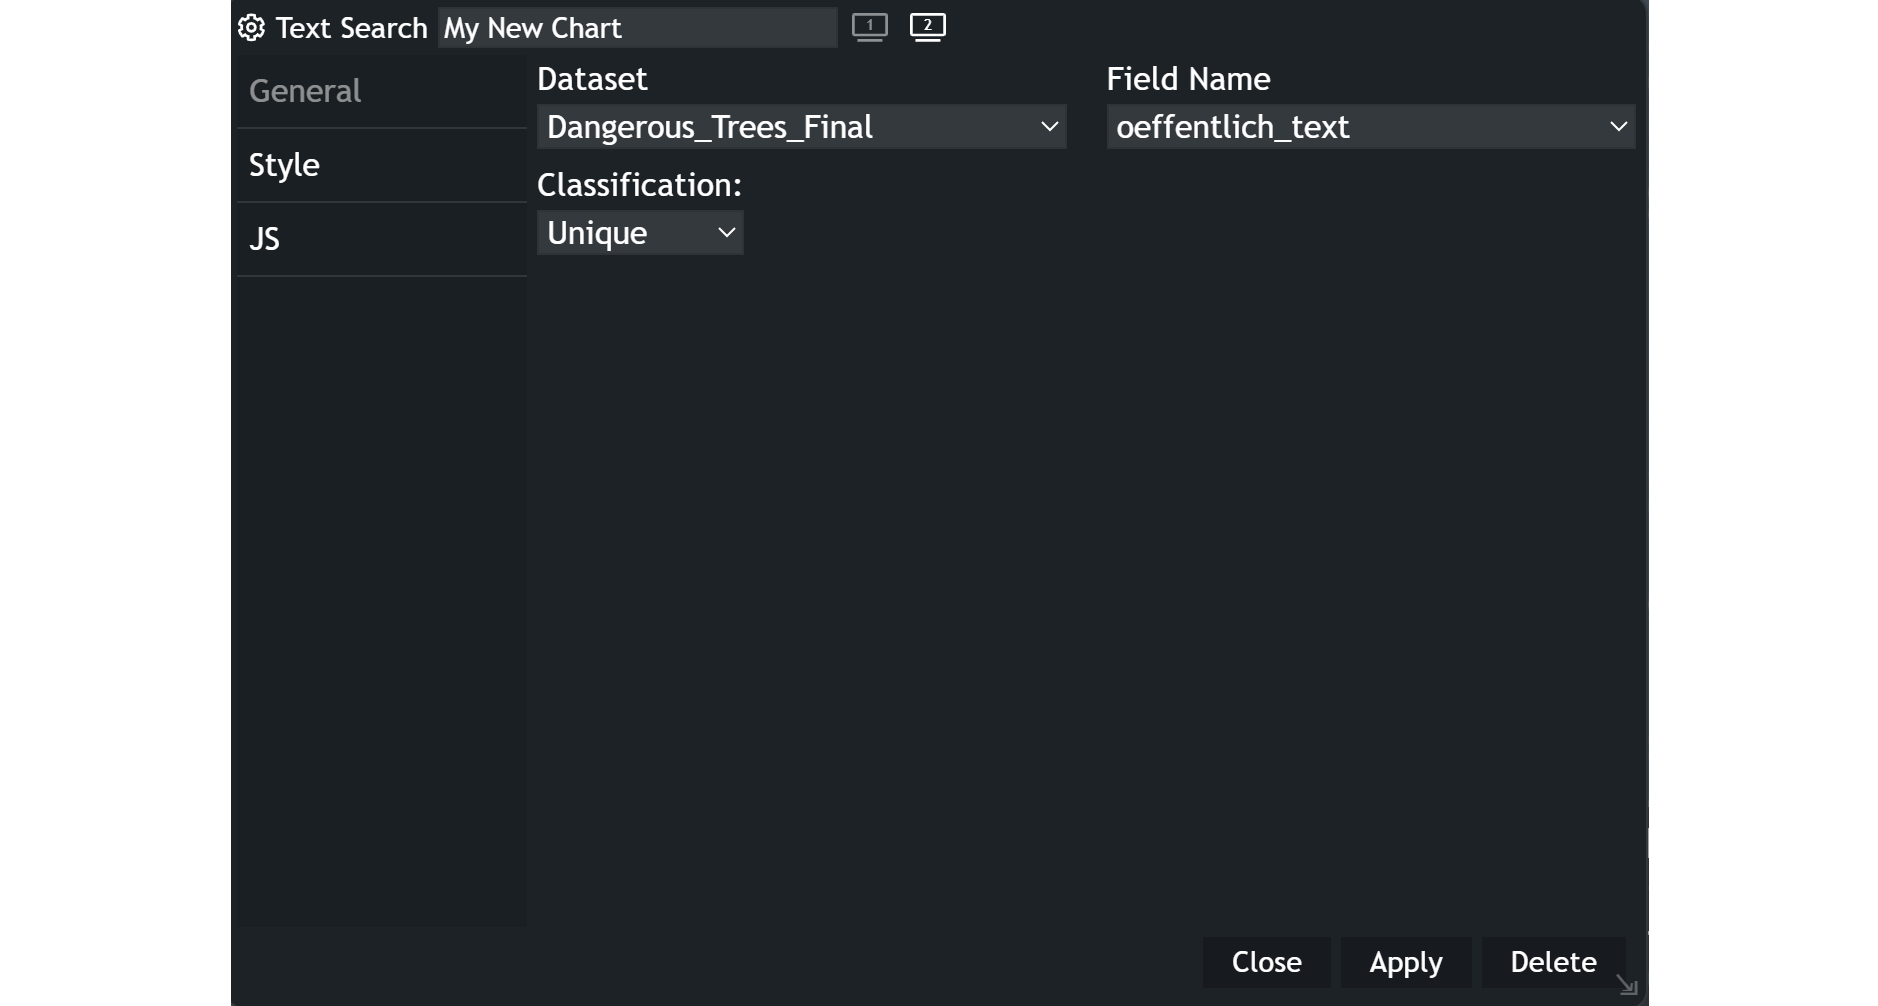
Configuring your chart
- Customize the chart name by clicking on
My New Chartat the top of the modal. - Choose your
datasetand the specificfieldyou want to display. - Select the
classificationcriteria that best suits your needs.
💡
Make sure that you attribute field is a text field, otherwise text search will not work. Although, you could enter numbers in the text search considering you have an attribute with number values.
Using the text search
- Click within the text box to begin. As you start typing, text filter suggestions will be displayed to help you select your filter.
- Click
Applyto set the filter. Once the filter has been applied, a small table will be displayed. You can add multiple filters.
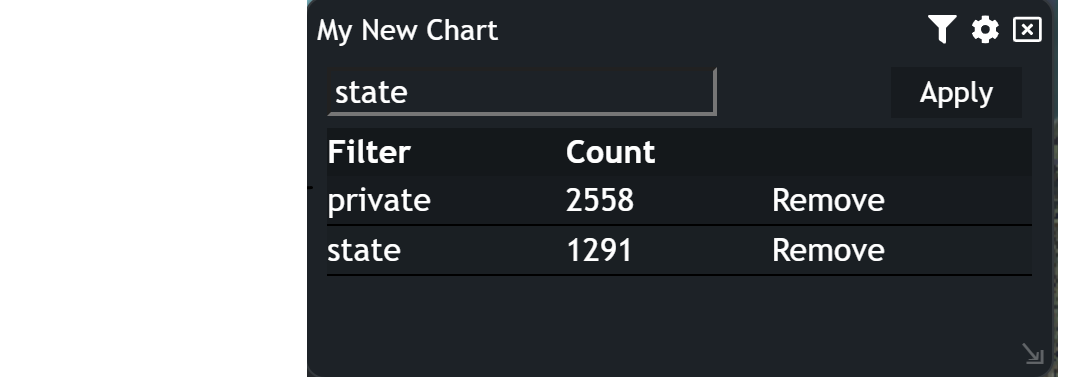
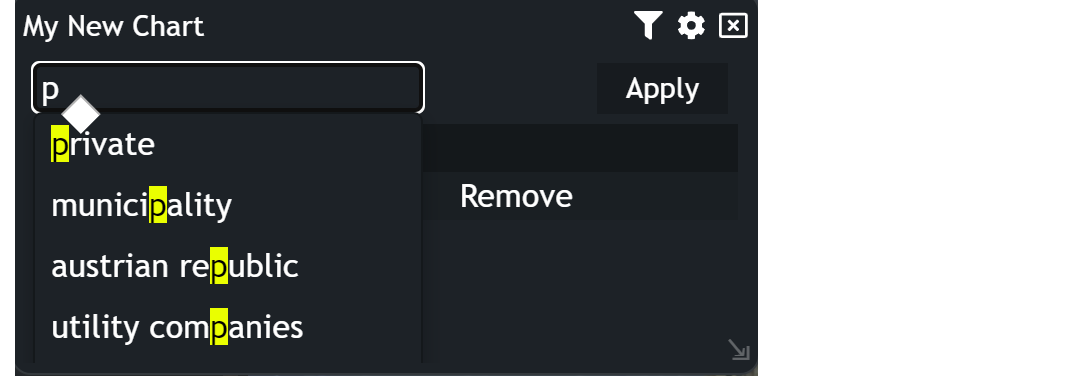
As the example shows, the filter is suggesting options for the letter or word typed in. When applied, the filters are displayed in a table with their count. There is also a Remove button for each filter to be deleted.