Compound
Combines two or more existing charts into a single unified chart.
In this post, we will explore the Compound Chart, a powerful visual tool that allows you to create a single unified chart by combining two or more existing charts.
Preliminaries
A compound chart enables you to merge two or more charts into a single chart to bundle information. You can use the following chart types: Line, Bar, Date; Before you start to create a compound chart, you will need to have at least two charts of the mentioned types ready to use.
💡
You can combine more than two charts, but be aware that the readability of your compound chart may decrease.
Creating a Compound Chart
Navigate to the widget menu and select Compound from the list of graph widgets.

Configuring your chart
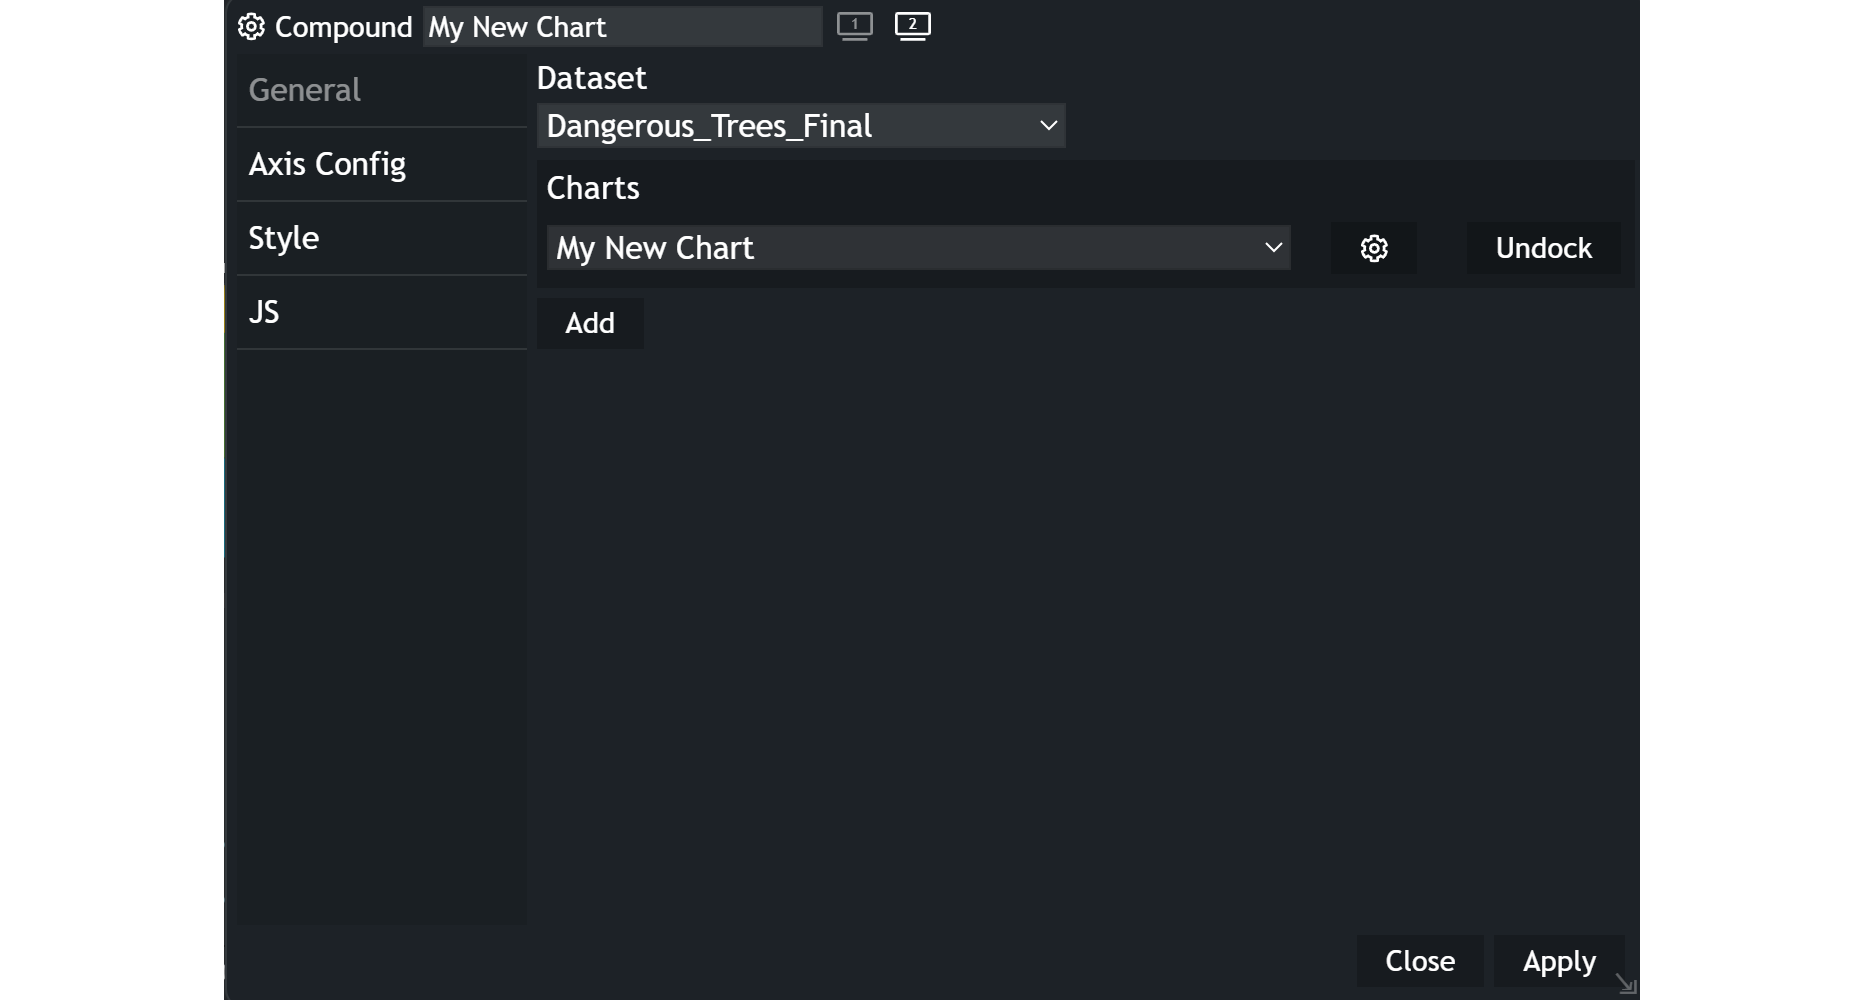
-
Choose the
datasetyou want to display. -
To add the charts:
- Click on the
Addbutton. - Select the desired chart from the Dock dropdown list.
- Click on the
-
To modify the selected chart, click on the configuration icon to open the respective chart configuration.
-
To remove the selected chart, click on the
Undockbutton.
Example
Updated on Aug 11, 2026