Day of Week
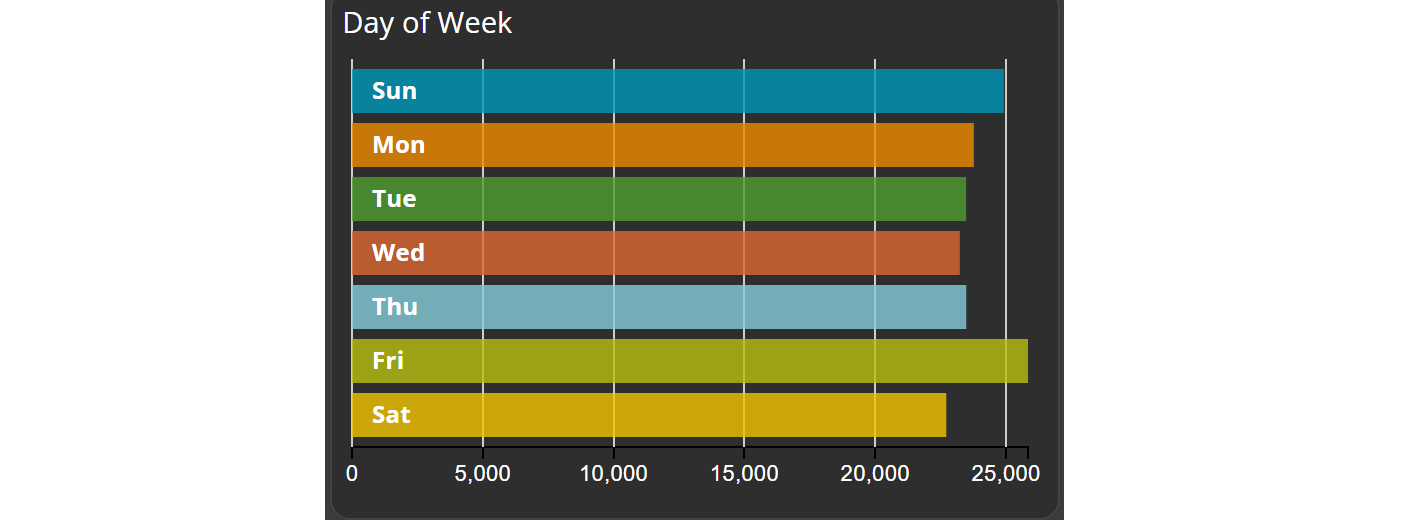
Shows the distribution of features by theme across the days of the week, as a bar chart.
In this post, we will explore the Day of week chart, a powerful visual tool designed to help you analyse the distribution of features based on themes over a day range using a bar chart.
The Day of Week chart simplifies data exploration and enables you to analyse data within specific day of the week.
Creating a Day of Week chart
To begin, navigate to the widget menu and select Day of Week from the list of Temporal Widgets.

Configuring your chart
Once you're in the day of the week configuration menu, set up your chart preferences.
- Customize the chart name by clicking on
My New Chartat the top of the modal.
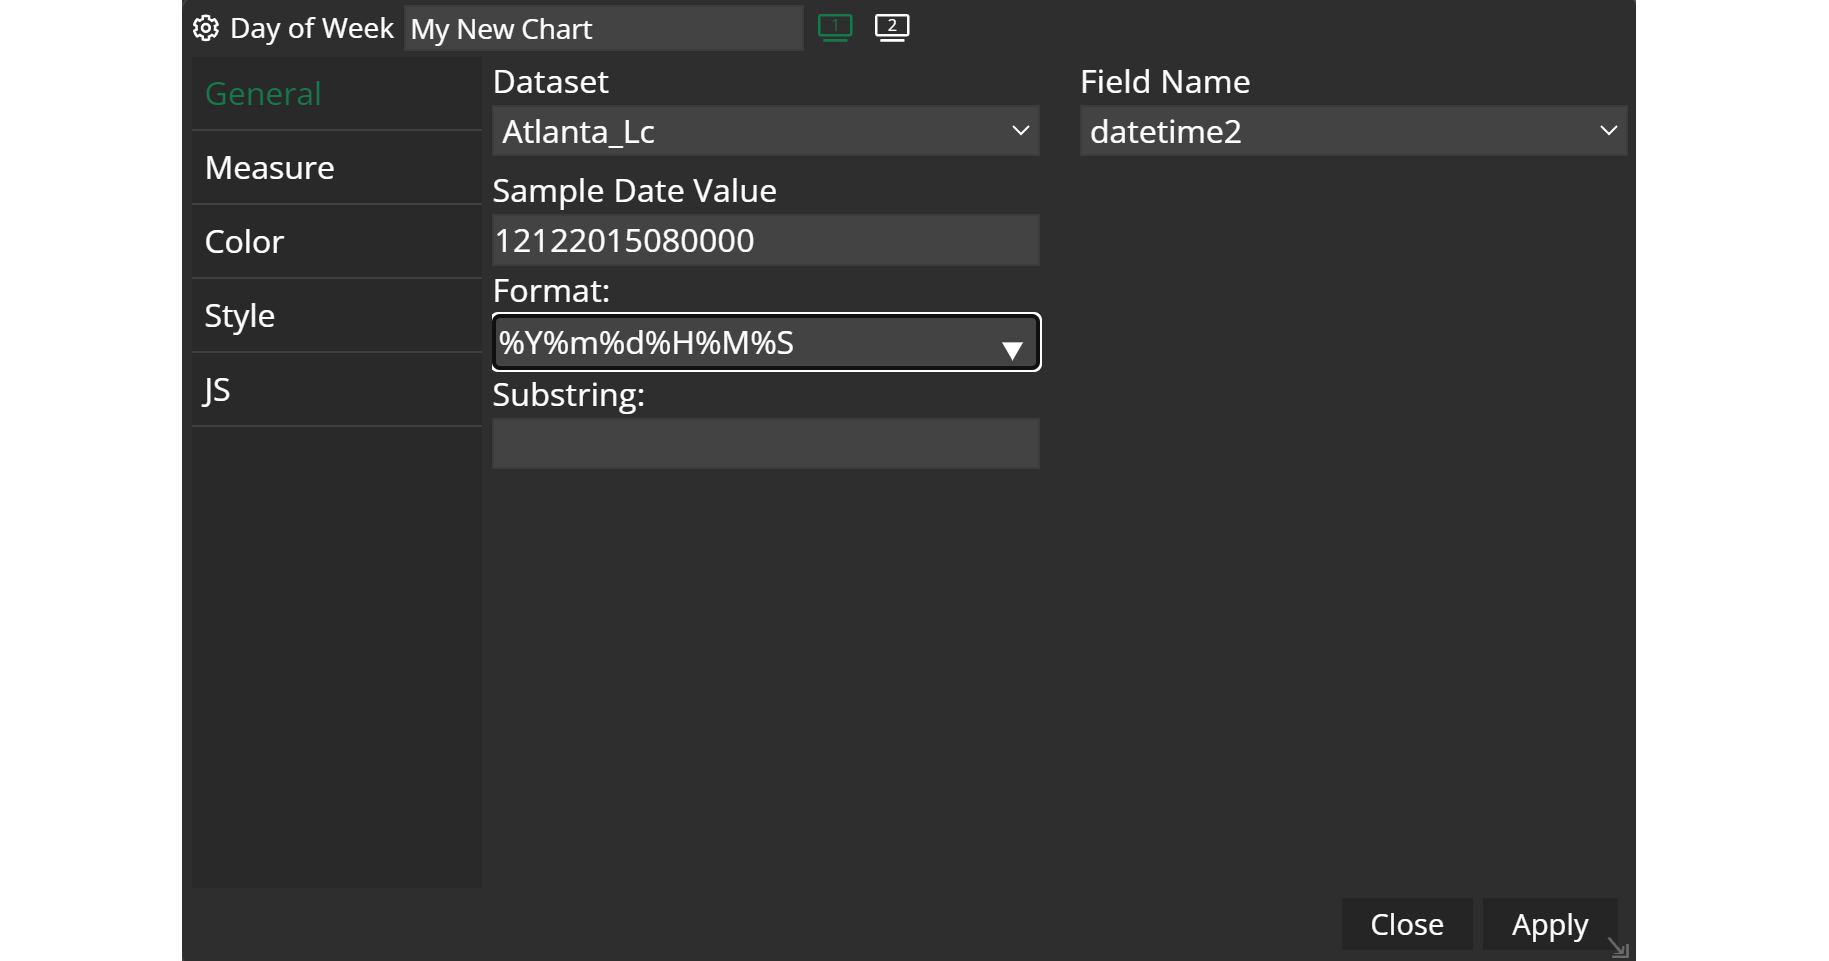
- Choose your
datasetand the specificfieldyou want to display. - A
Sample Date Valuewill appear showing one example from your attribute. This will help you to select the appropriate date format. - Select the
formatthat best suits your needs- For Example: %m%d%Y
- Decide the
substringyou need.
Example
Updated on Aug 11, 2026