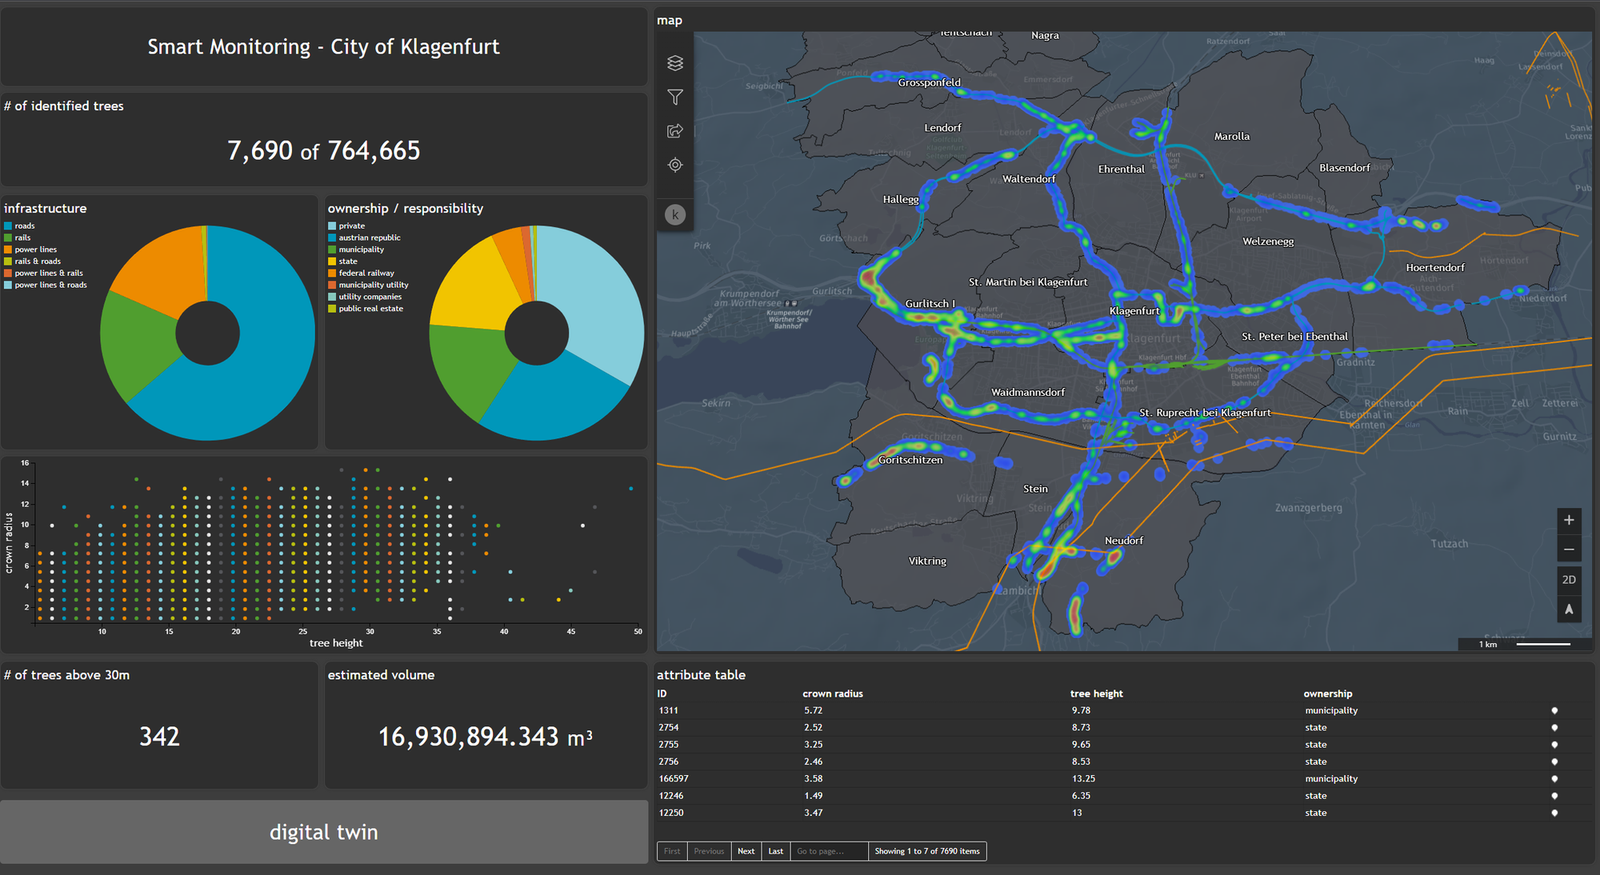
Dashboard

What are Dashboards? Dashboards are additional browser apps that can be built with M.App Enterprise Studio. However, this kind of browser app is based on a specific template integrating a map view with a set of predefined BI widgets. The widgets are connected to a thematic map based on point, linear or polygon features. Dashboards are particularly suited to analyze datasets in an easily understandable way. Selections made within the BI widgets are automatically displayed on the map and other widgets and vice versa. This provides a highly dynamic and interactive dashboard view for gaining insights about hidden patterns in the data
Preliminaries
Additionally to the native spatial data support of M.App Enterprise, Dashboards support most common geospatial formats, including:
- GeoJSON, TopoJSON
- CSV
- SHP
- REST endpoints
- OGC WFS
External videos
M.App Enterprise Studio preparation
First configuration steps
Further widgets