Sunburst
In this tutorial, we will explore the Sunburst Chart, a powerful visual tool that allows you to visualize a hierarchical dataset.
Introduction
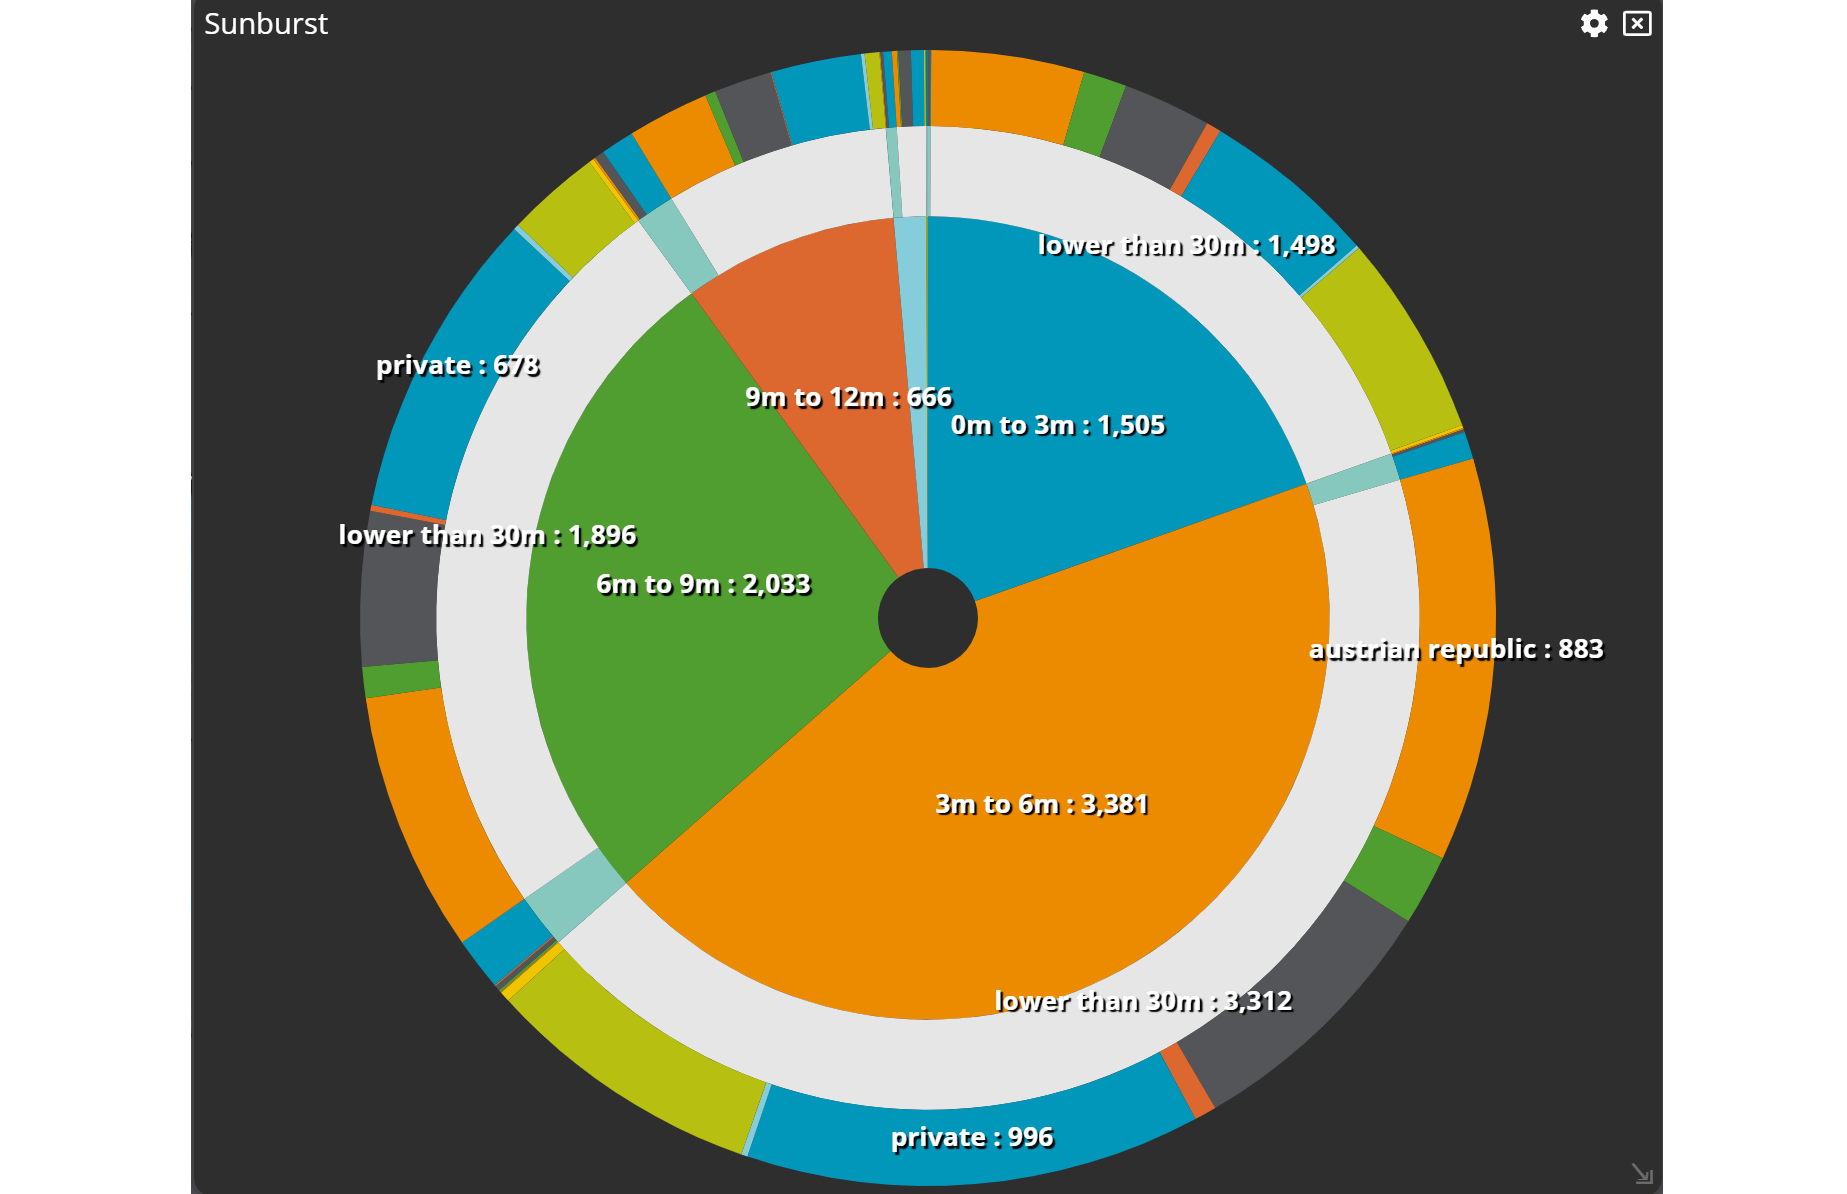
A sunburst chart comes with one or more levels of hierarchy, each presented in a ring. An inner circle, similar to a pie chart, is surrounded by a more detailed categorized circle , which can again be encircled by another ring of more detail. In that way, you get a hierarchical structure of you data.
Creating a Sunburst chart
To begin, navigate to the widget menu and select Sunburst from the list of Graph Widgets.

Configuring your chart
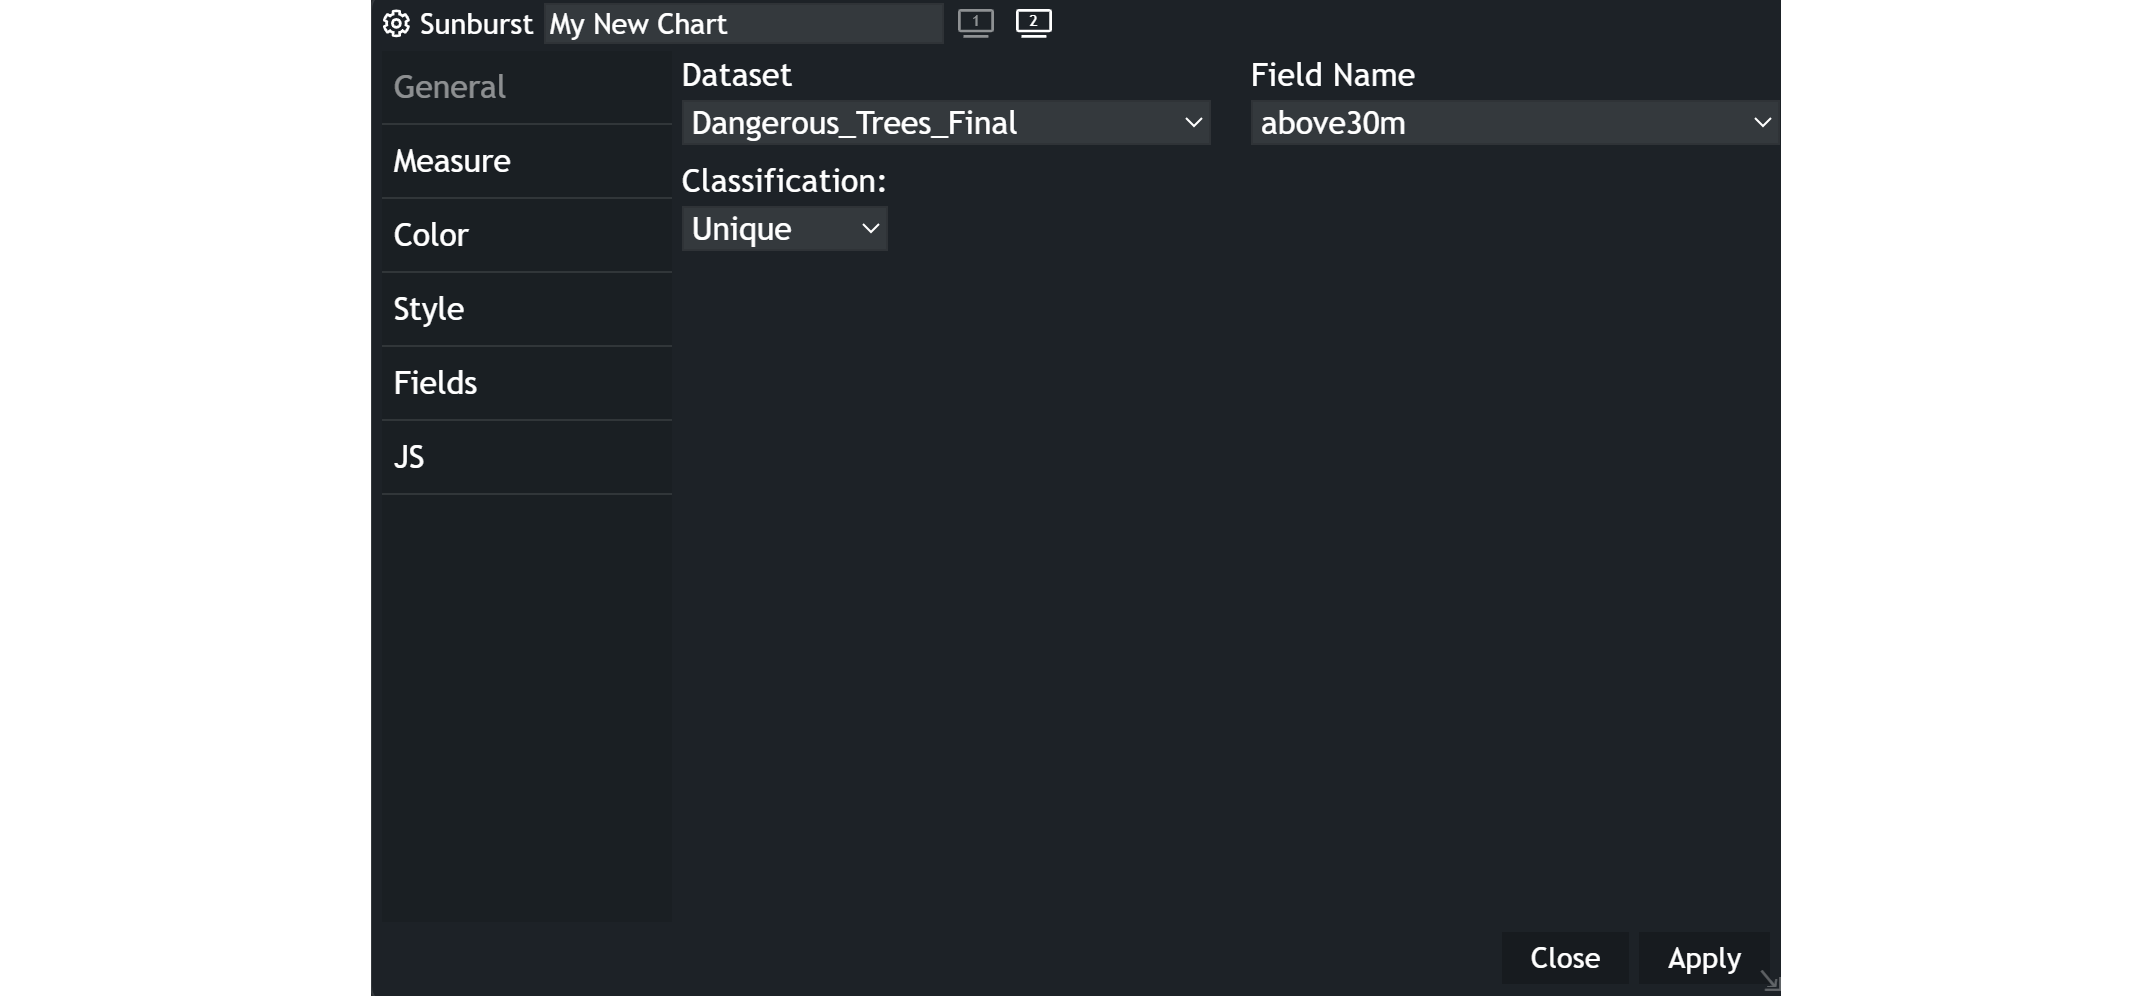
- Customize the chart
nameby clicking on "My New Chart" at the top of the modal. - Choose your
datasetand the specificfieldyou want to display. - Select the
classificationcriteria that best suits your needs.
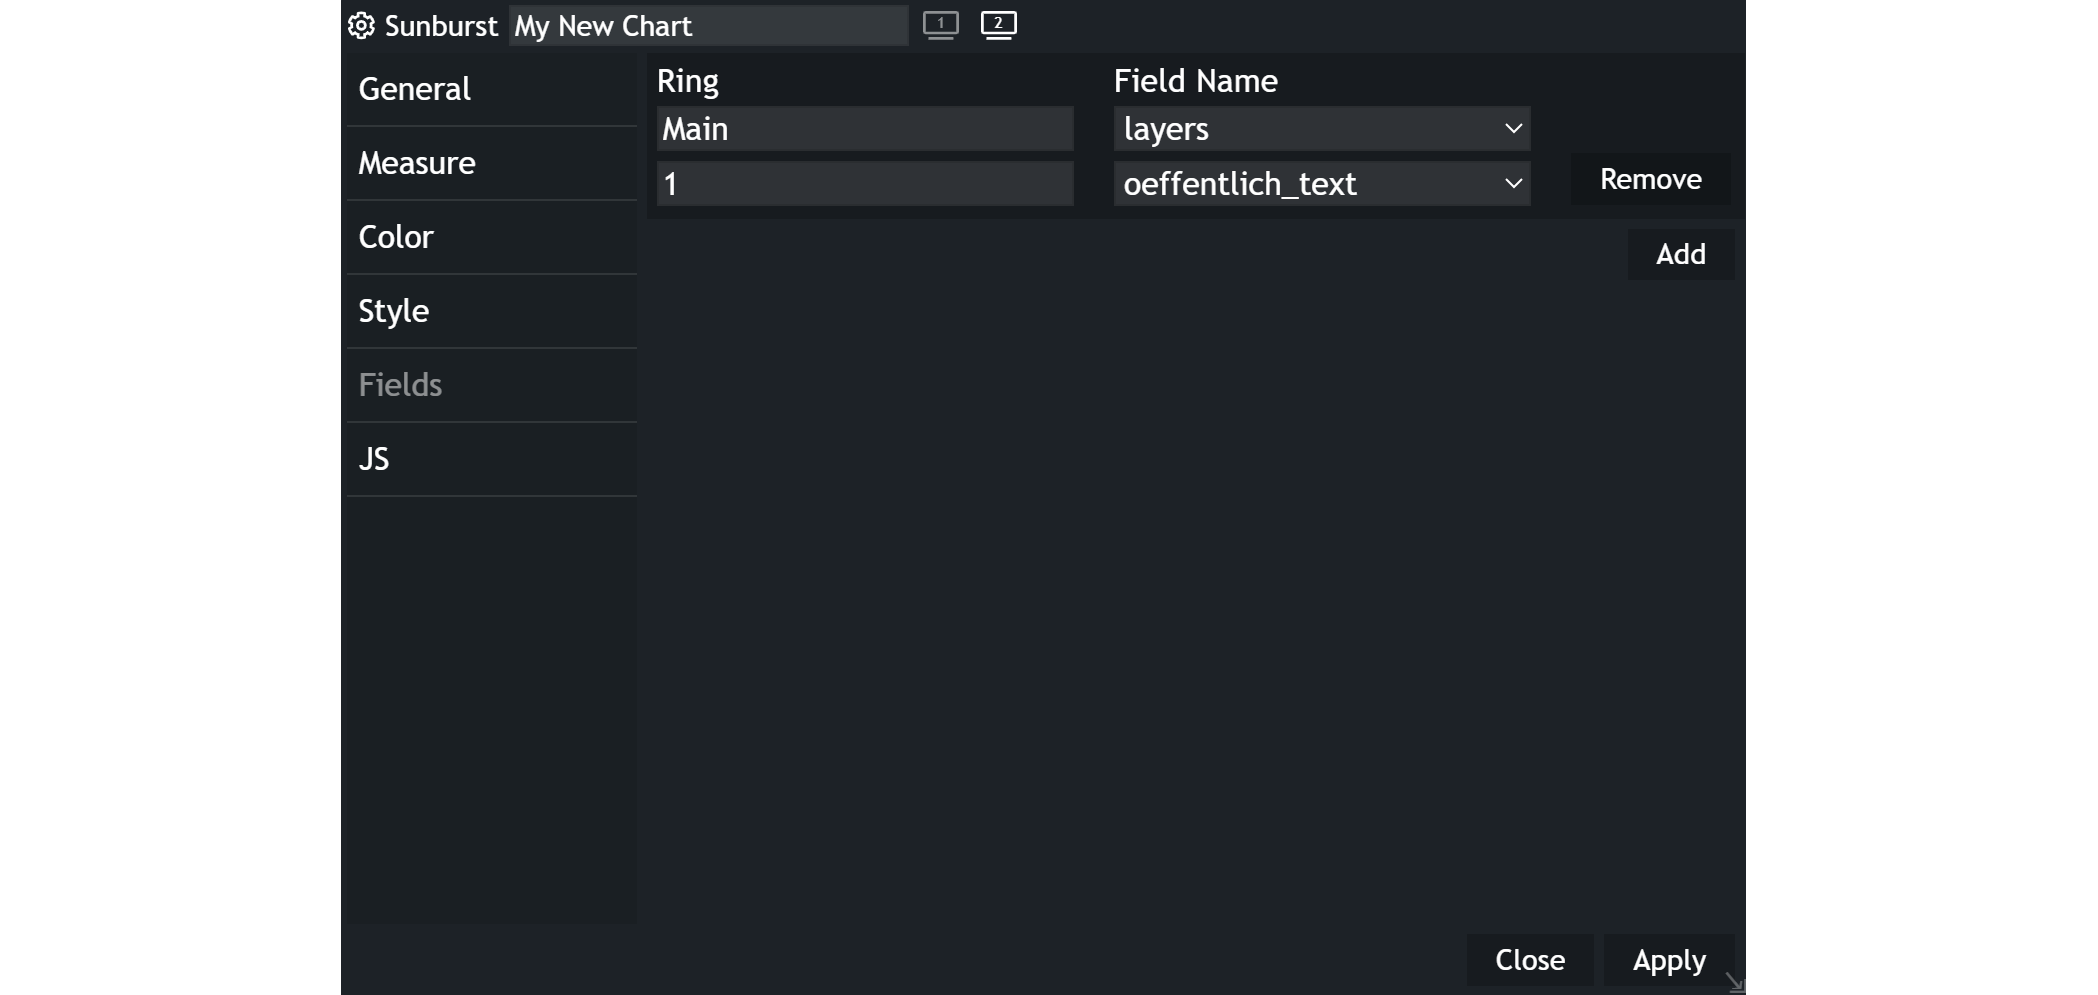
Adding another ring
To make use of the advantages of a sunburst chart, you can add one or more rings of detail. Just click on the Add button in the fields menu and choose the appropriate layer. Rings can easily be removed with the Remove button.
Example
As you can see in the example, there are three rings, each displaying the distribution of one attribute.