Pie
In this post, we'll guide you through using the Pie chart. You'll also learn how to apply filters to focus on the features you need on the map.
The Pie chart is a visual representation that displays the distribution of features, grouped by a specific attribute, using slices in a pie chart format.
Creating a Pie Chart
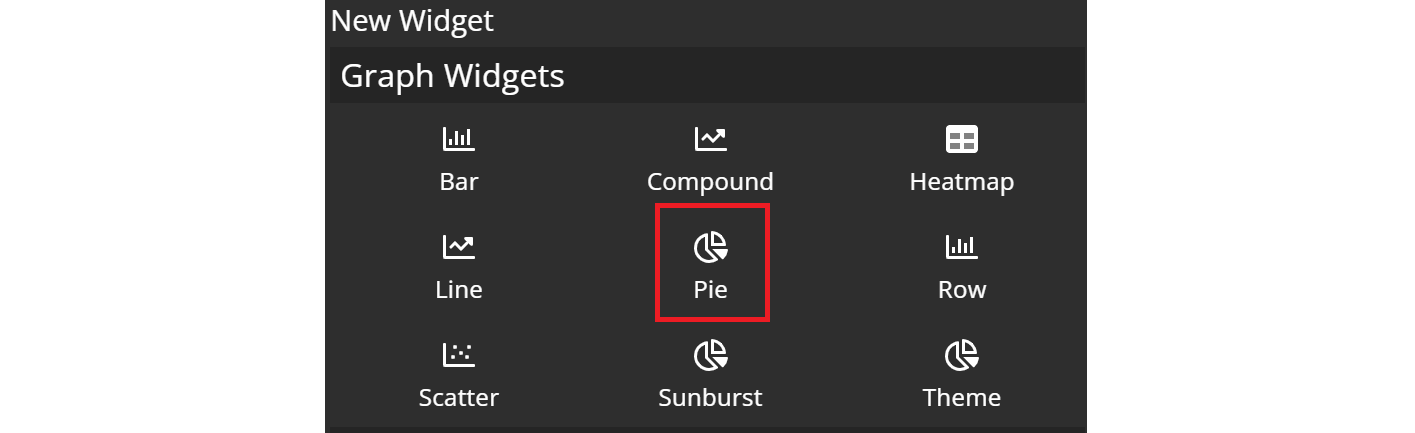
Select Pie from the list of Graph Widgets in the widget menu.
Configuring your chart
Once you're in the pie configuration menu, set up your chart preferences.
General settings
- Customize the chart name by clicking on
My New Chartat the top of the modal.
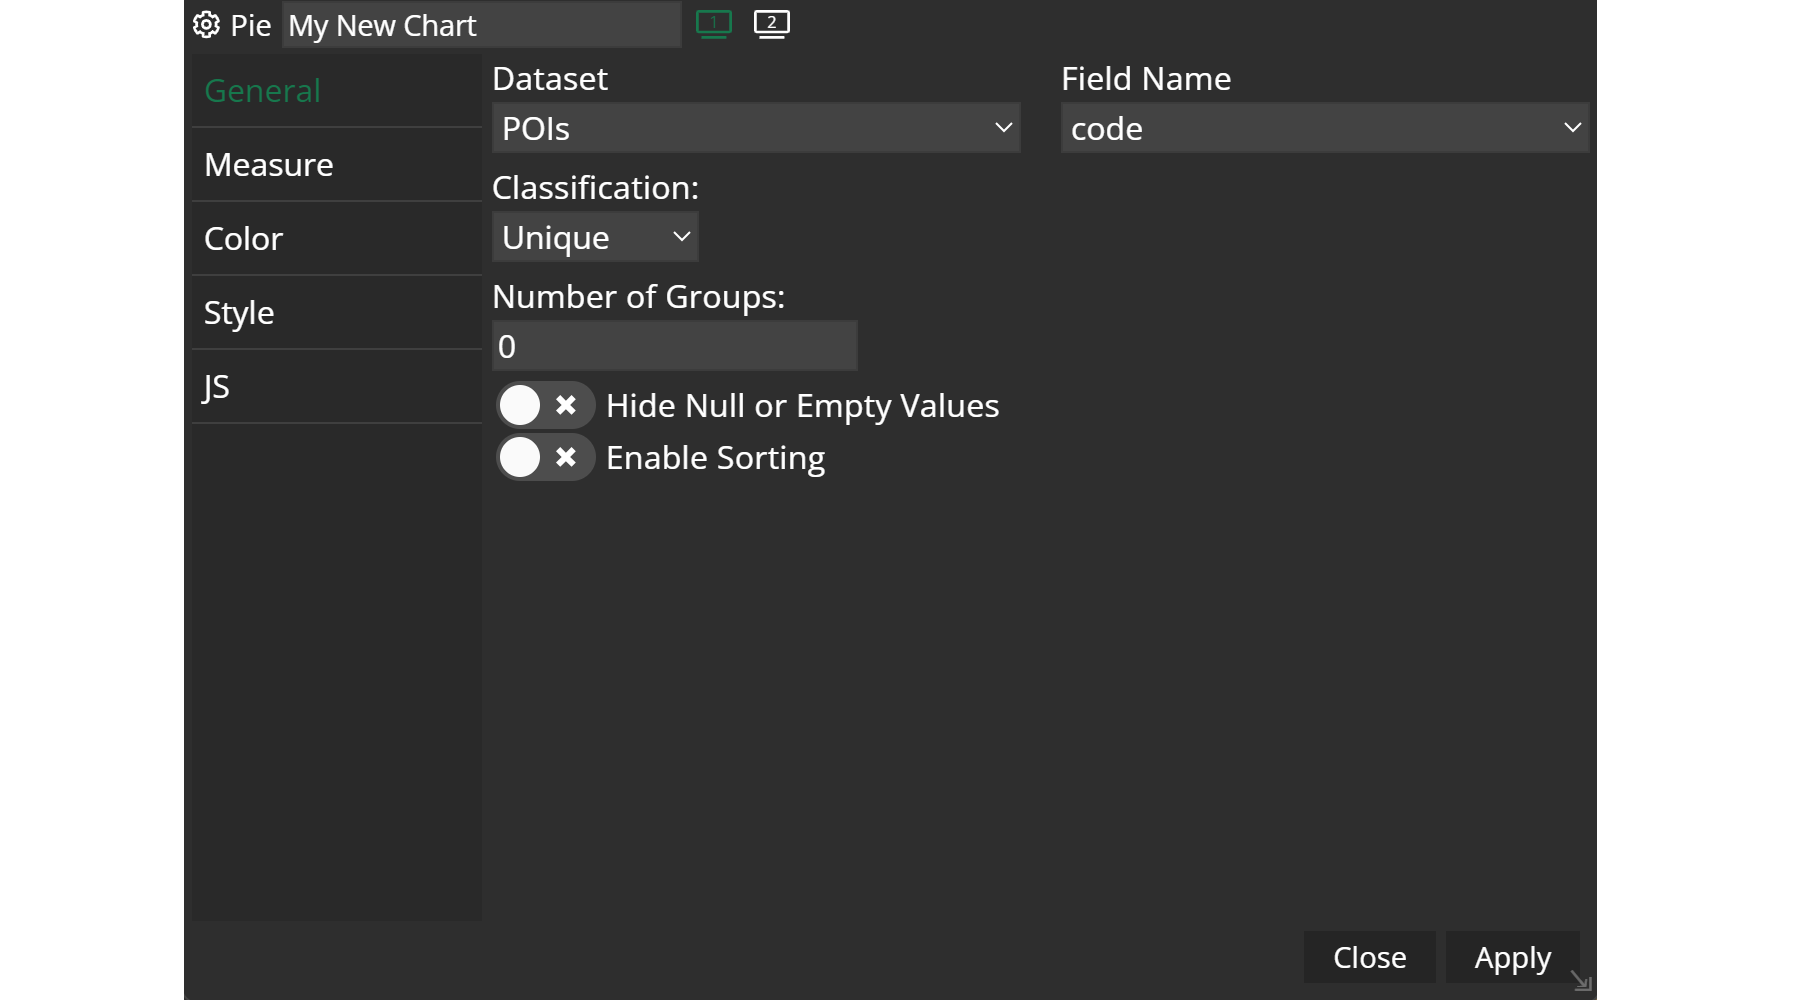
- Choose your
datasetand the specificfieldyou want to display. - Select the
classificationcriteria that best suits your needs. There is a number of options available how the classes are generated:

- Select the number of
groupsyou wish. - Decide whether you want to
hide null or empty values.
Measure settings
Here you can decide on a measure type. For instance, Feature count will take every feature into account, where same values will form a class. If you pick Sum, you can indicate another attribute, that will be summed in each class. In total, there is a number of options selectable:

Moreover, you can display the values or percentages as labels in your chart.
Example
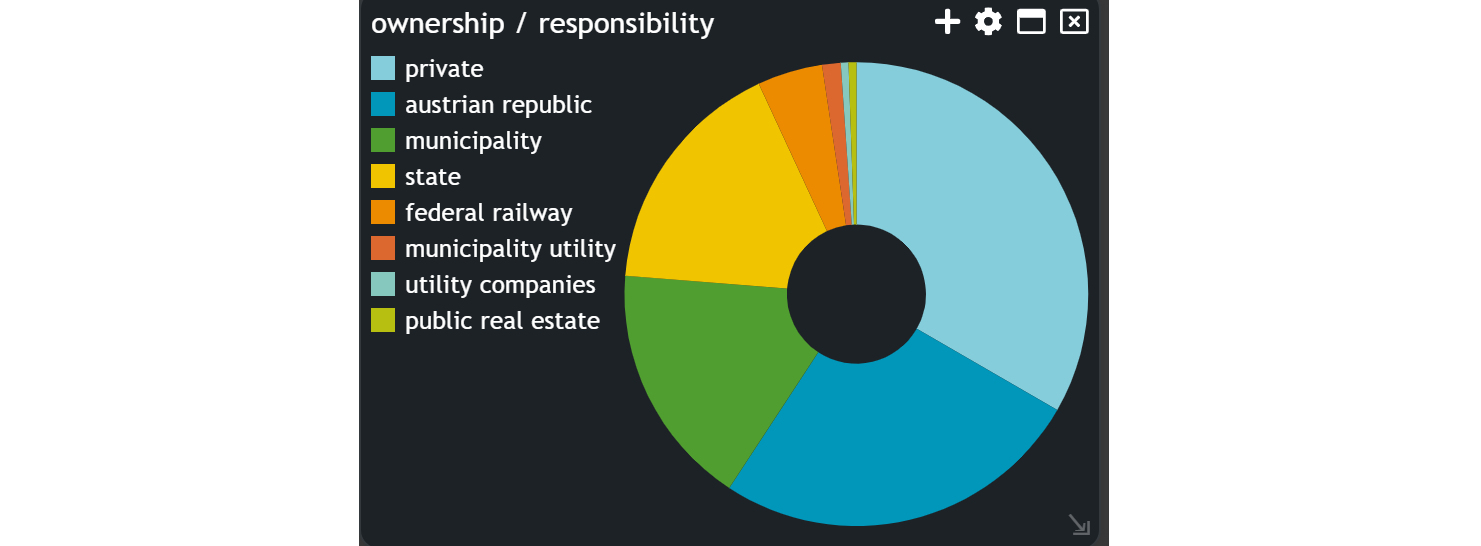
You can view your created chart directly in your Dashboard App.