Data Table
The Data Table chart is a tool for displaying and organizing data. In this post, we will guide you through the process of utilizing the Data Table chart.
Creating a Data Table
To begin, navigate to the widget menu and select Data Table from the list of display widgets.

Configuring your chart
Once you're in the bar configuration menu, set up your chart preferences.
- Customize the chart name by clicking on
My New Chartat the top of the modal. - Choose the
datasetyou want to display.
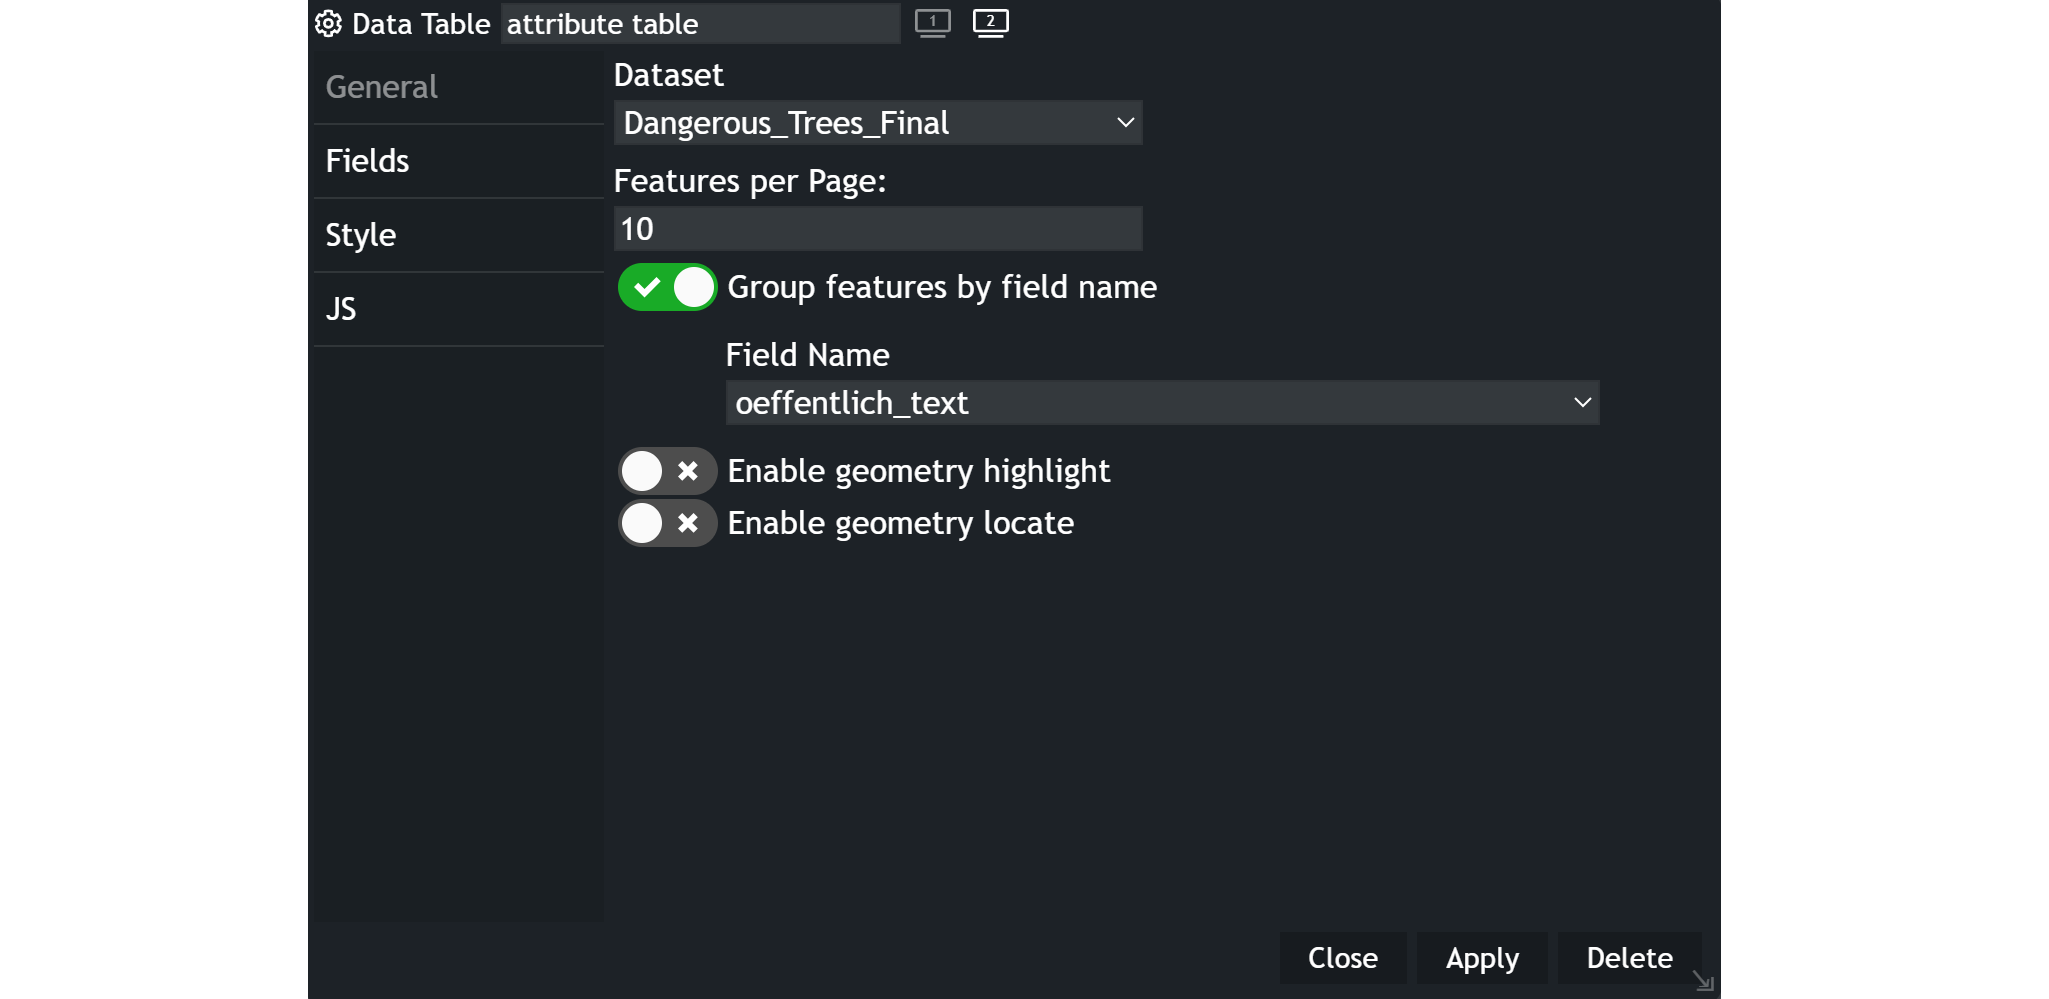
- Define the
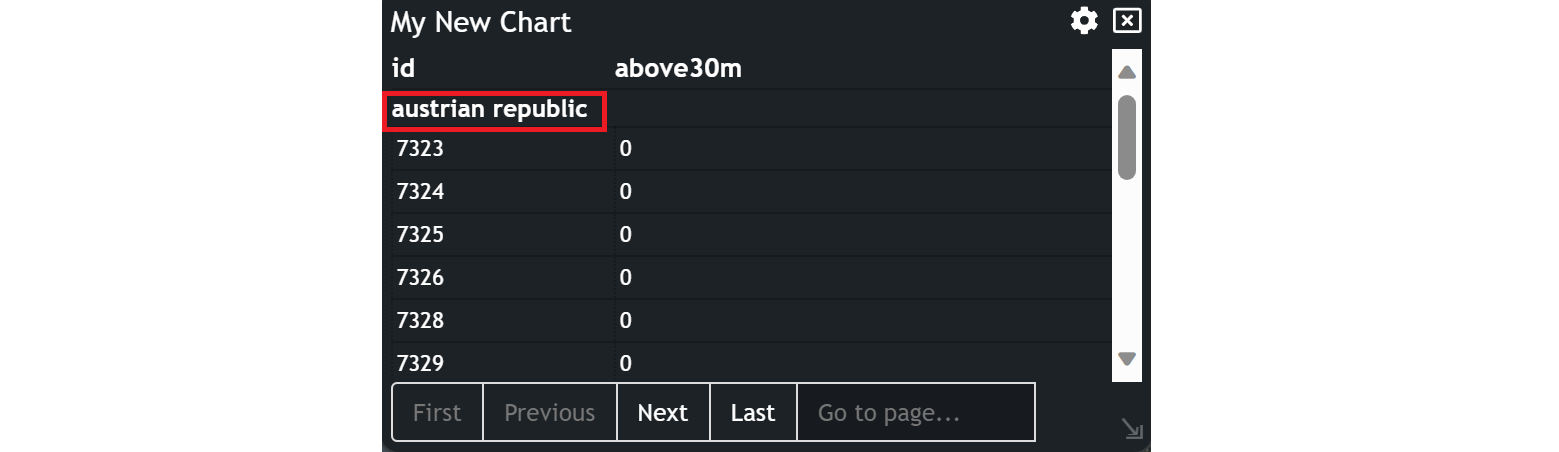
Page Featuresas you wish:Features by page: how many rows will be displayed in the widgetGroup features: You can group your data by any attribute, like in the example below, where it is grouped by the ownership attribute. The table indicates all data belonging to the austrian republic, thereafter for the next group of values and so on.Geometry highlight: highlights a single geometry in the map. A tutorial to this topic can be found hereGeometry locate: Location pin icons will appear in a column. They are clickable and forward you to a single geometry on the map.
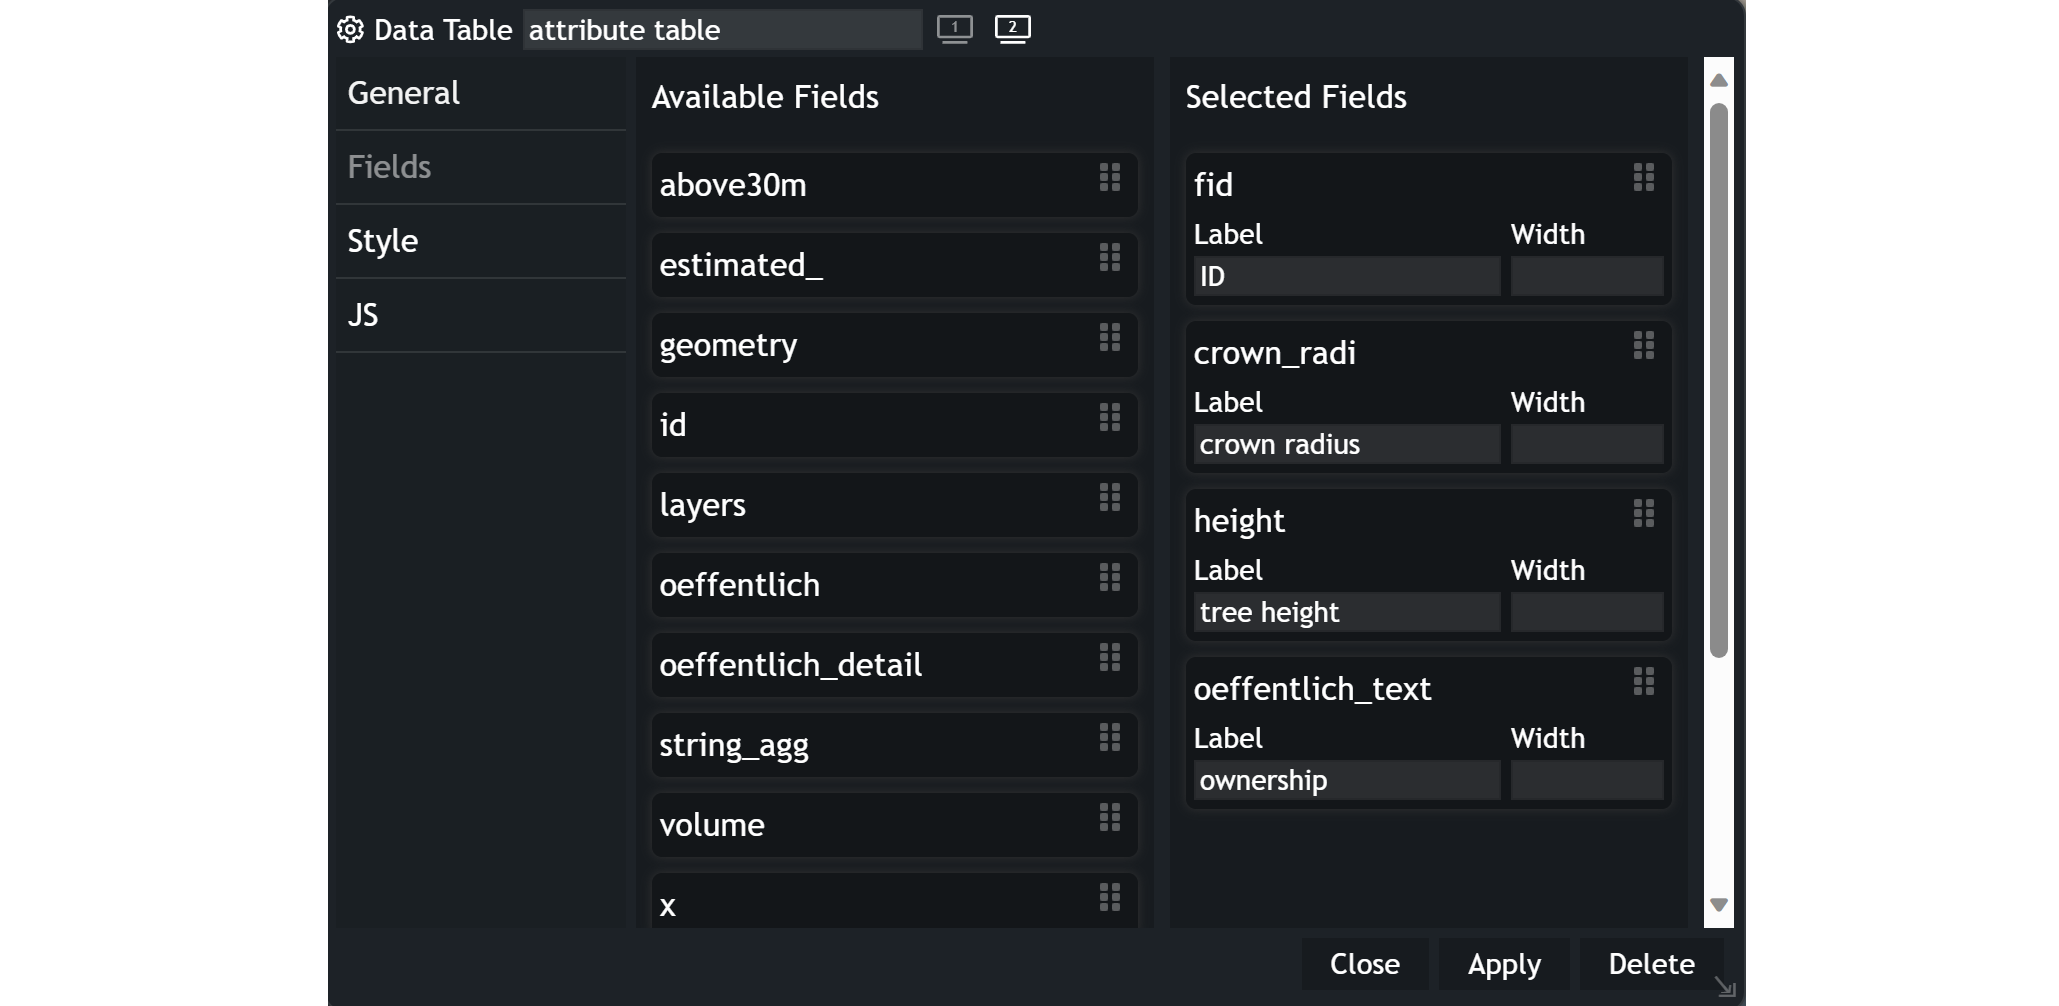
Select a field
In the Fields section, you can decide which fields to include in your chart. You can either drag and drop data from the Available fields list to the Selected field list or add all data with the Add All button.
🧠
Remember to select at least one field to populate your chart with data.
Using the data table
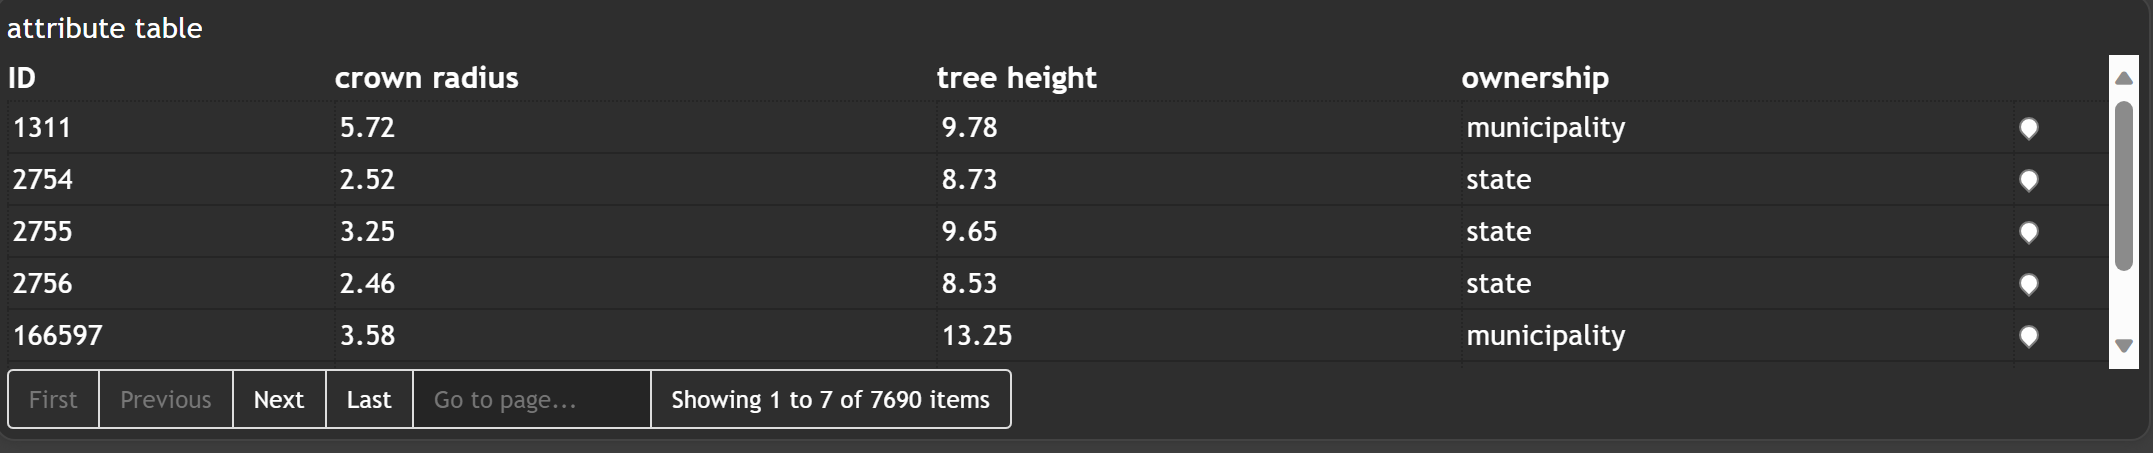
This is how a data table might look in your app. In this example the features by page was set to 10, but since the window is too small to show them all, there is a scrollbar. You can jump to the next or the last 10 elements. Moreover, you can sort each column by simply clicking on the column name.