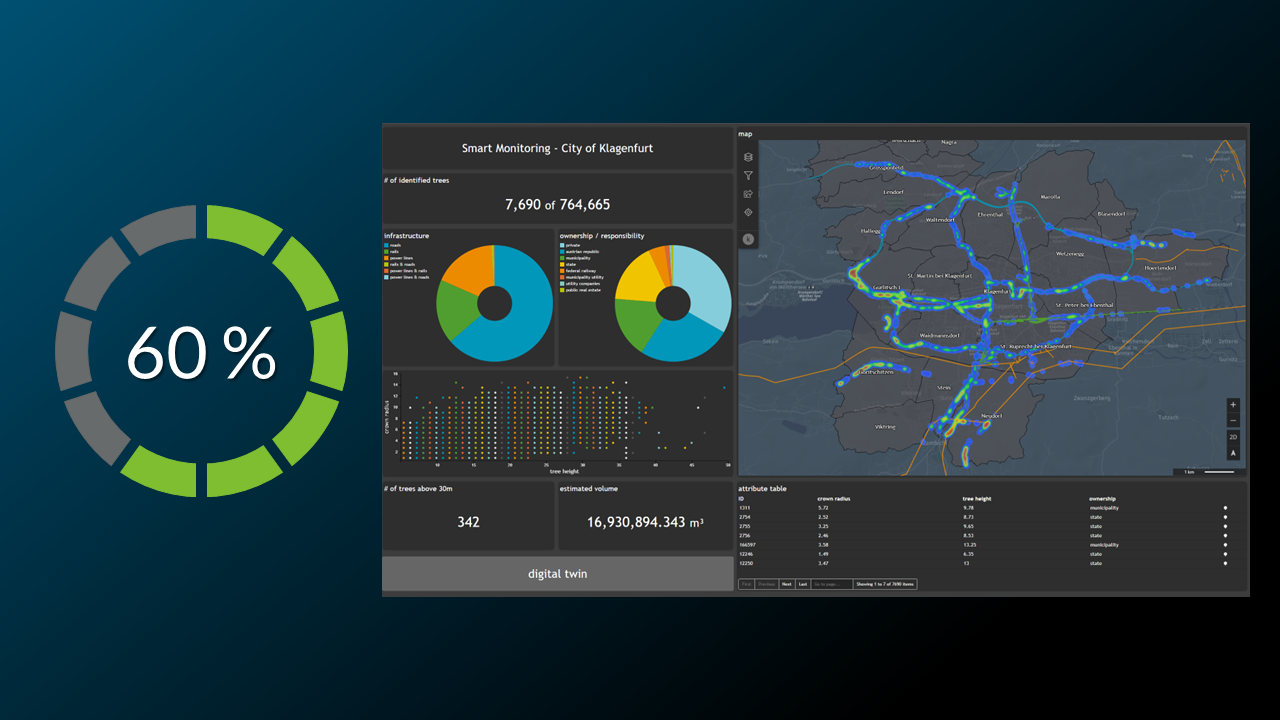
The result of this tutorial is to create the following Number display widget
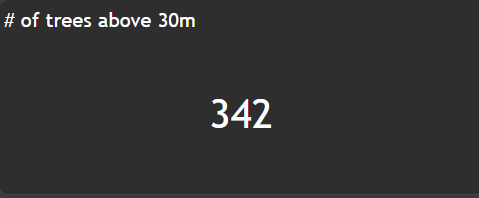
We want to show all necessary settings in order to achieve that. Every needed tab in the
Widget configuration window is highlighted with a seperate header.
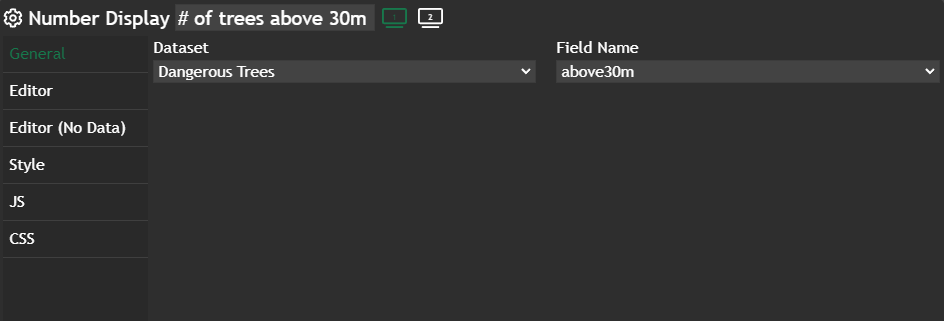
General
In this tab the only thing we change is theChart title to # of trees above 30m and change the Field Name to the corresponding column.
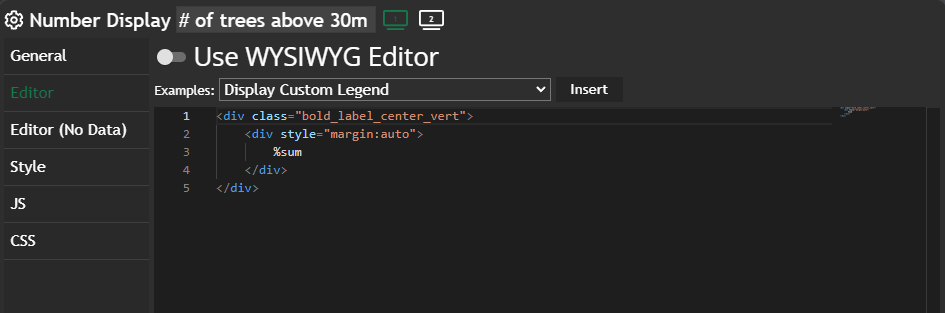
Editor
If you don't use the WhatYouSeeIsWhatYouGet (WYSIWIG) Editor, you will get a full-blown code editor with autocomplete and Intellisense. We define a%sum, which gives us automatically the total number of currently visible geometries in the Map widget.
We are re-using the same CSS class as defined in this post.
Further information
If you need further information about this kind of widget, please visit the following link.
Number & HTML display
This content post will revolve around both number and HTML display charts, as they are very similar to each other. ⚠️
The Number Display chart is read-only and serves as a valuable resource for presenting data in a clear and concise manner. It allows you to showcase data reports, averages, or
 Marina Lanxinger