Lesson 3: Import vector data in M.App Enterprise
This tutorial will outline the steps to import vector data in M.App Enterprise and shows the options you will have to stream your data.
Preliminaries
Make sure to have your spatial datasets in one of the following database management systems:
PostGIS, Oracle, Microsoft SQL Server, Hana
Spatial indexing is mandatory, as this data structure enables the querying and retrieval of spatial data. It is also indispensable to assign a valid EPSG code to each of your datasets.
MAE import
Content -> Vector data -> New
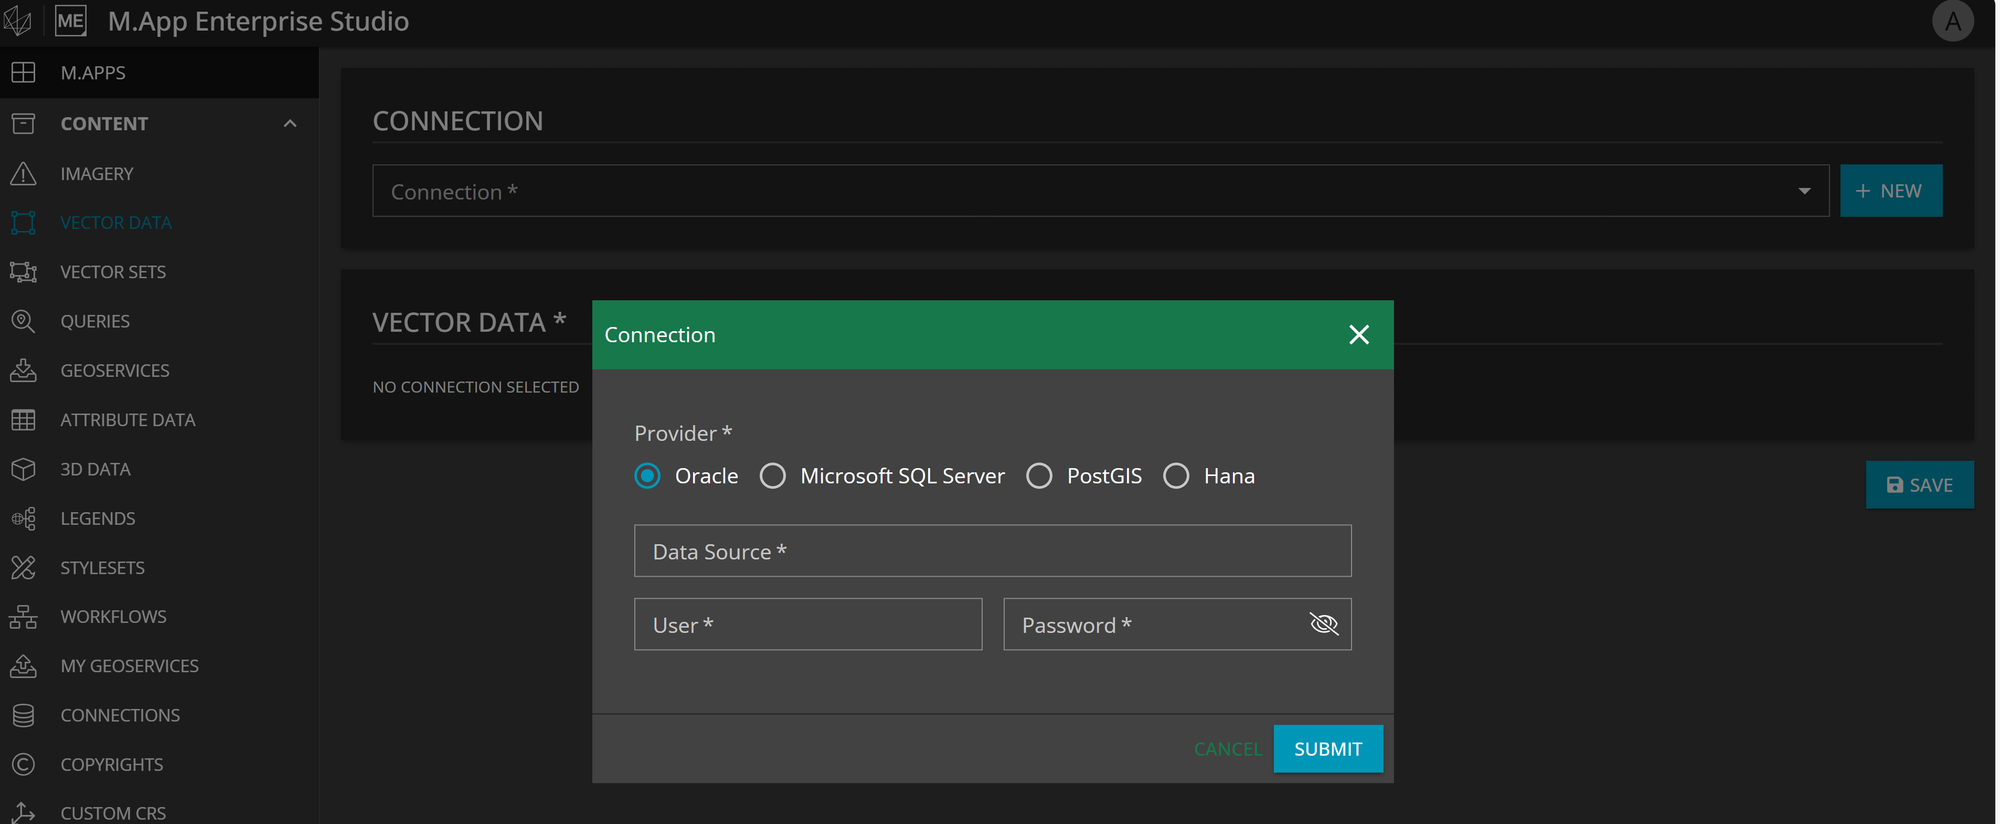
Under Content in the sidebar you choose vector data and click on "New". Then you can either use an existing database connection or define a new one by clicking on "New" again. Select the provider and complete the form with your database specifications.
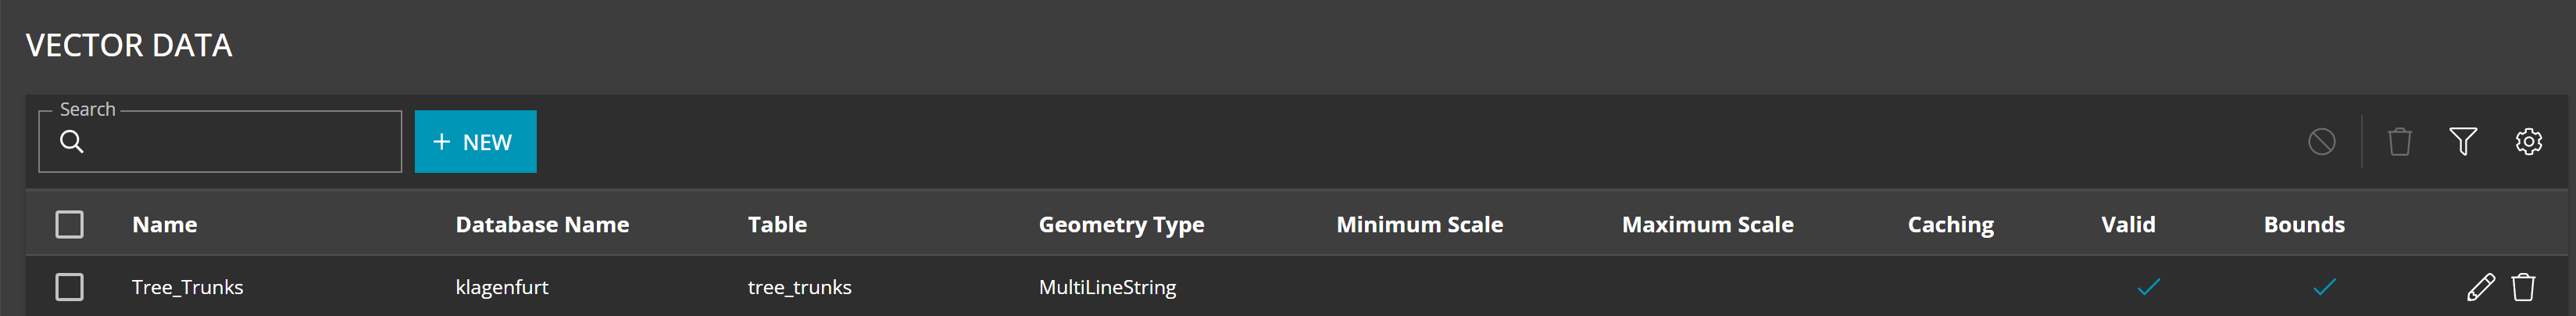
Once you are connected with your database, all the available tables are listed. Choose the desired one and rename it to a unique name without spaces. In the legend you can rename it again to a more appealing name.
The EPSG code shows up automatically if a SRID was assigned beforehand. In this case the EPSG code should not be changed, as you will get a warning that says "Layer bounds outside of CRS bounds". Moreover, it would lead to a wrong location of the geometries in the map. However, there is a possibility that your vector layer does not have an EPSG code yet and you have to assign one during the import. Especially for empty tables used and populated with data in workflows, this is an easy and quick option to appoint the appropriate projection. Layers without a specified or an invalid EPSG code, will be shown as "not valid" in the layers list and cannot be streamed in your application.
Furthermore, it is optional to indicate a minimum or maximum scale for the layer or to cache it. More detailed information on cached data can be found in the tutorial below.
 Stefan Schüttenkopf
Edit a vector layer
It's possible to edit a vector layer by clicking on the edit pencil in the vector data list or simply somewhere in the row of the specific vector layer.
By one click you will reach the edit form your specific vector layer.
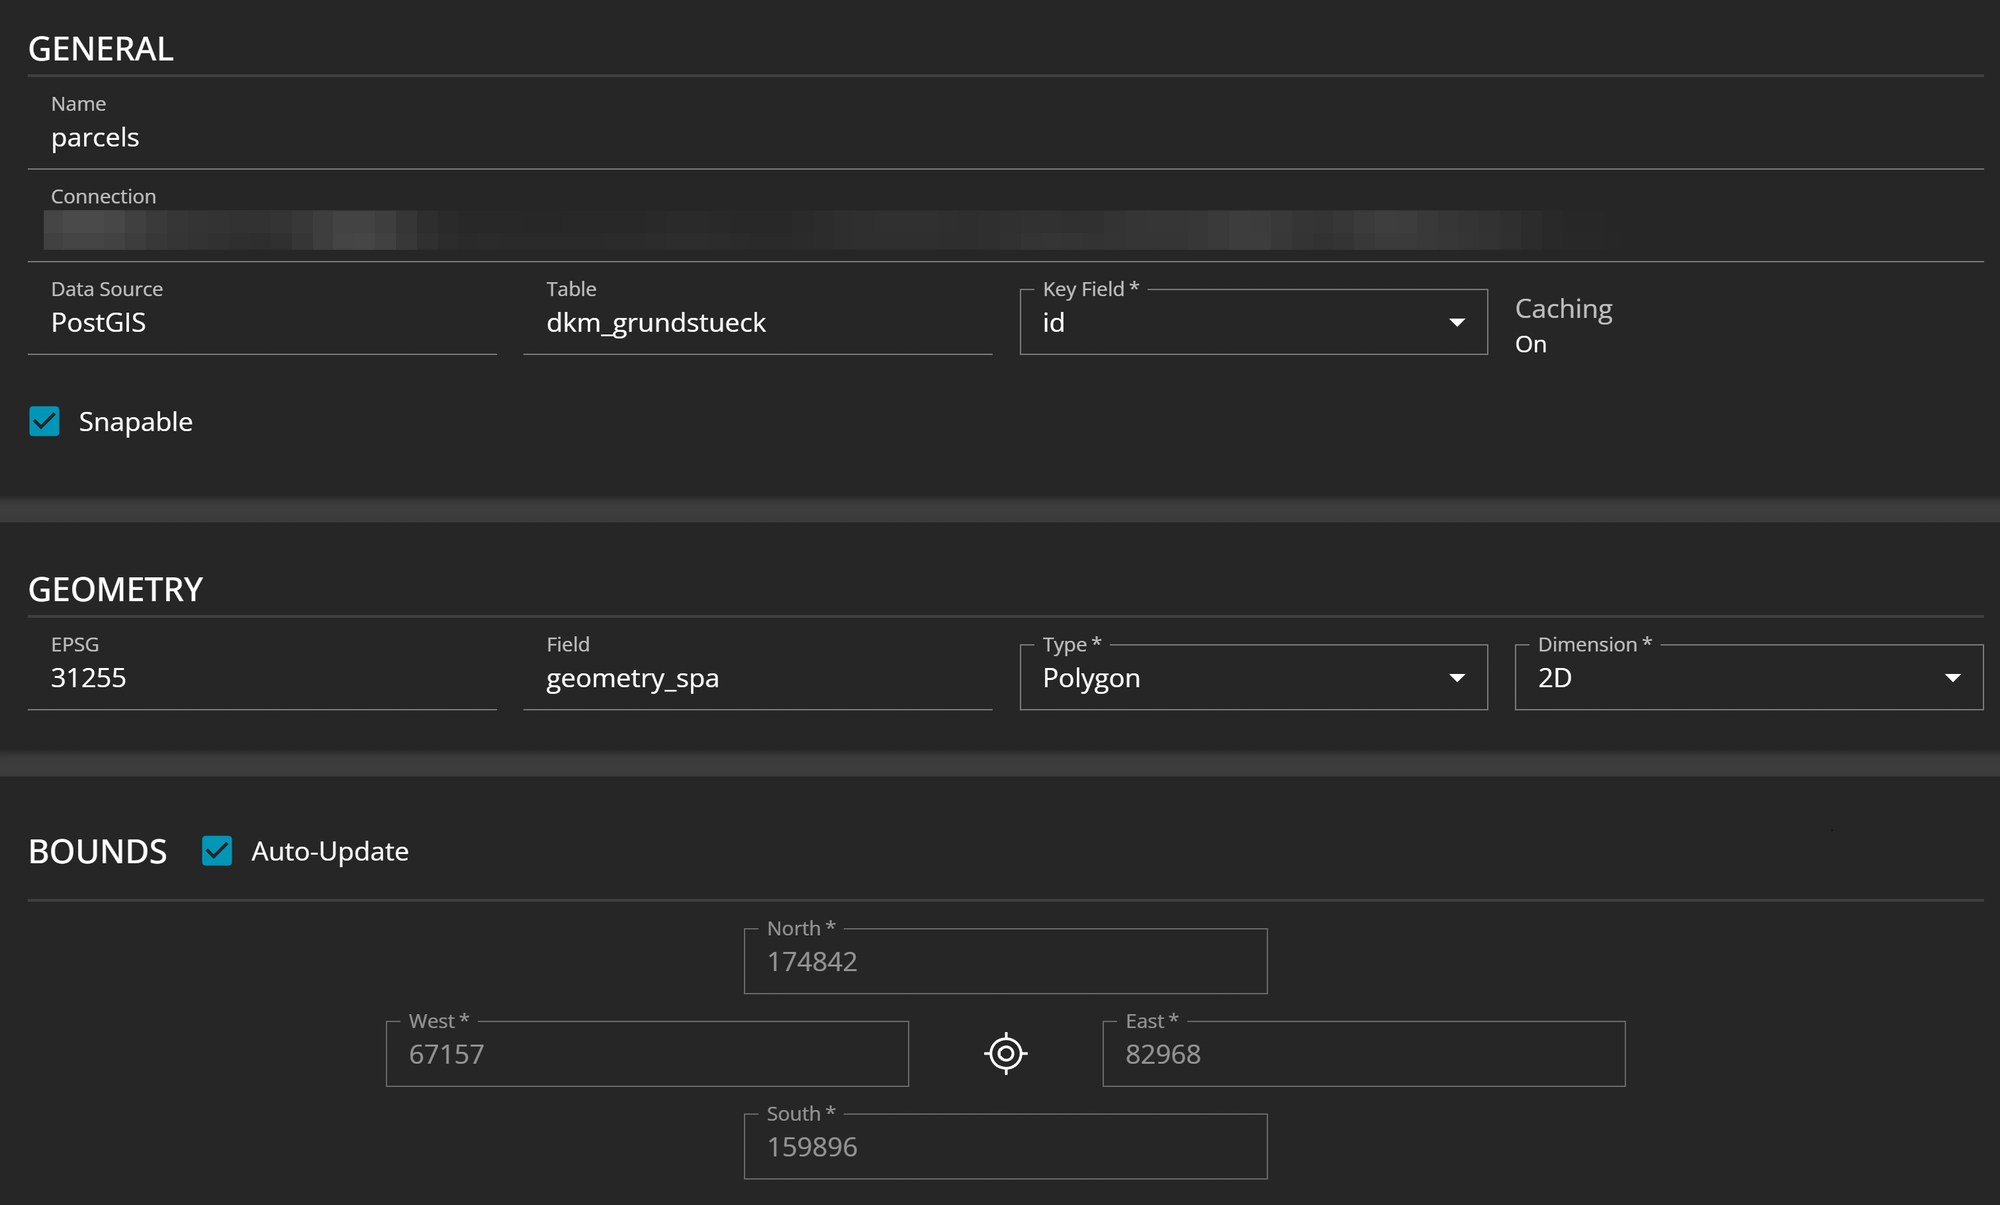
As you can see in the above image, you have several options to alter settings.
The key field indicates the primary key, which uniquely identifies each row of a dataset. It is mandatory to specify it and it is usually a sequential number. If your dataset doesn't have a unique key field, the visualized geometries will be incomplete and it's not possible to query them for any usage.
Another editable feature is dimension. It determines whether your data will be streamed in a two- or three-dimensional view in your application, which will be dependent on your datasets. However, there is another option to chose 4D, which is suitable for 3D data with an additional measure value (e.g. time or distance).
Type
The type specification expresses the geometry type of the layer and there are various options.
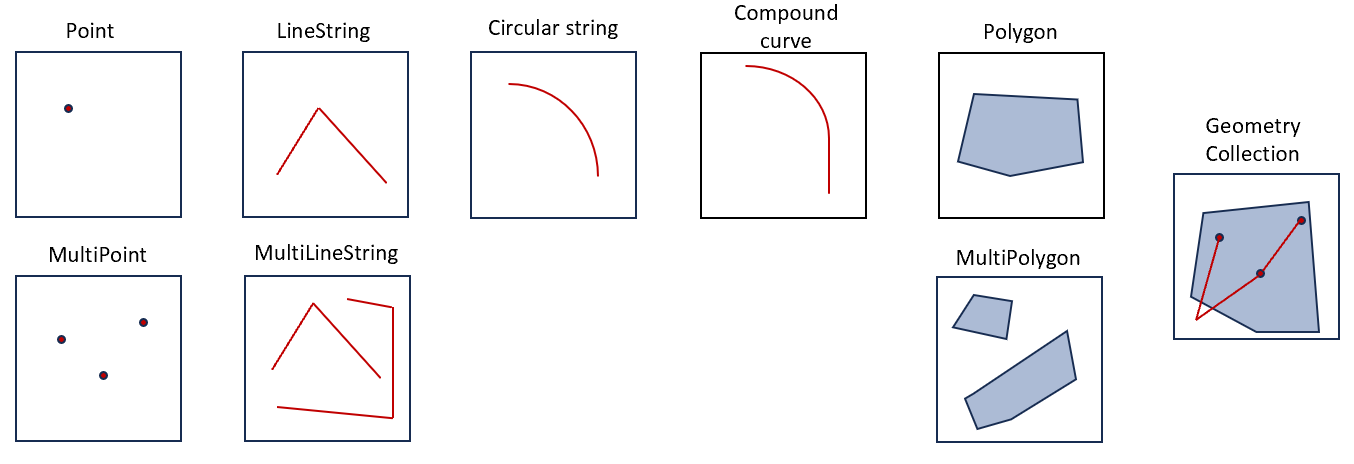
There are a few more complex geometry types:
A Curve Polygon is similar like a polygon. It has an outer ring and zero or more inner rings. Each ring can be a circular string, compound curve or line string.
Surface: A surface is a contiguous three-dimensional shape where each position has a dedicated value or relation to a fixed point. For example, it can be used for elevation data to indicate the topography of an area.
Polyhedral surface: It describes a specific surface with flat polygonal faces.
A triangle is a polygon with three non-collinear vertices. It has four coordinates, whereas the first and fourth ones are equal.
Triangular irregular network (TIN): A TIN consists of a 3D network of contiguous triangular faces with nodes and edges. It basically connects data points and represents a surface.
Buffersize Factor
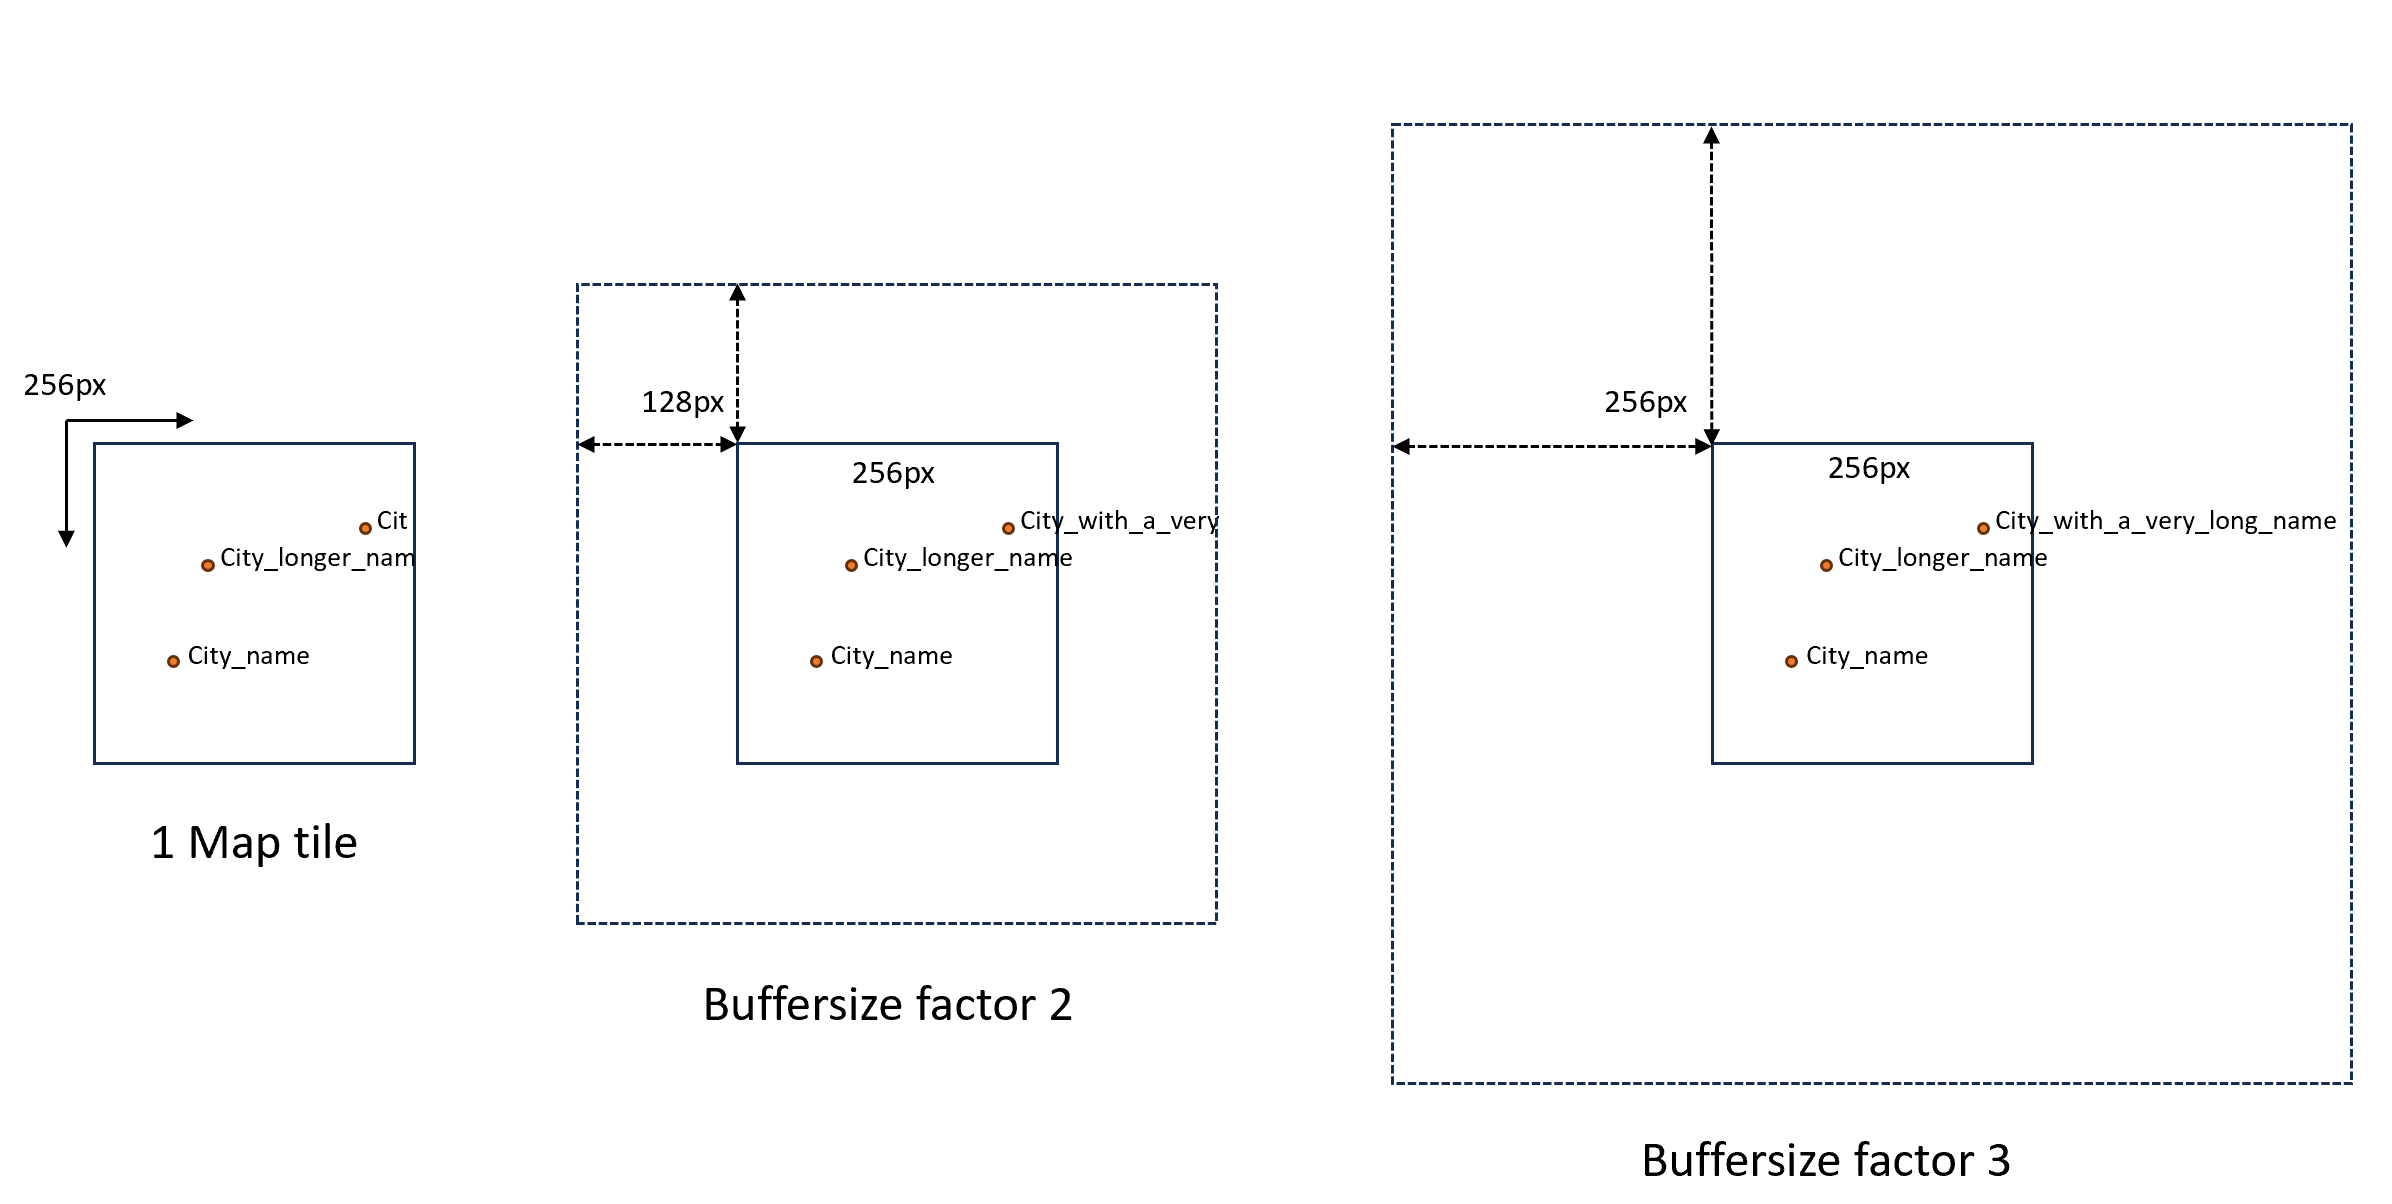
This setting is essential when you want to create a labelled WMTS from your vector data, so the label text is not cut at the end of a tile.
Imagine, that each map tile covers 256 x 256 pixels. If you have city labels, like in the example below, with long names that stretch outside of the tile in which the geometry is located, the names will be cut. By adding a buffer around the map tile, it can be prevented. A buffersize factor of 2 would add half of it (=128pixels) to each side, while a buffersize factor of 3 adds 256pixels to each side and a factor of 4 would add 384 pixels, and so on.
Filter
This filter enables server-sided filtering from the database. Considering you have a large dataset covering a whole country, like buildings in Austria, but you only need a certain extent from it in your project, like the city of Klagenfurt. It will enhance the performance when you don't have to load the entire dataset from your database. Filtering can be done with SQL.
Examples: id < 100 type='office'
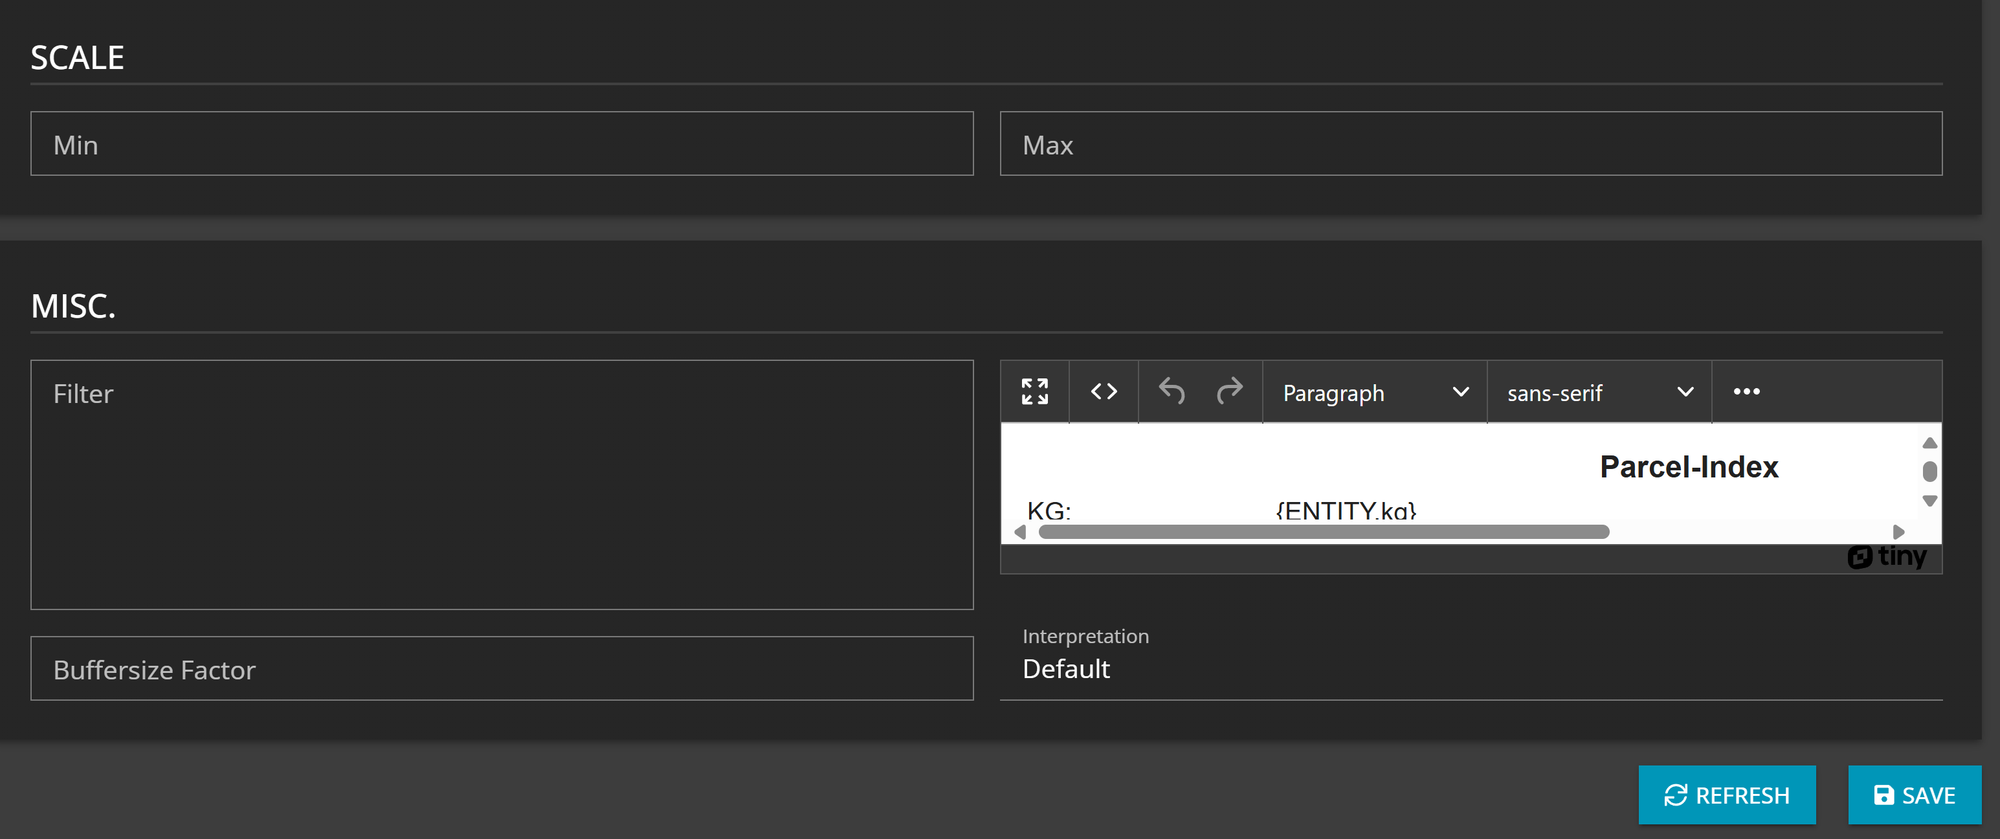
Tooltip
A tooltip allows you to show more information about a certain geometry. If you want to add a basic tooltip to a vector layer, use the following definition and replace "<column name>" with the actual column that you want to show in the tooltip:
{ENTITY.<column name>}
As soon as you type in "{" you will get the first five columns of the table suggested. As it is autocomplete, just start typing the first letters of the desired table.
For a more advanced tooltip have a look at the following tutorial.
Markus Holler