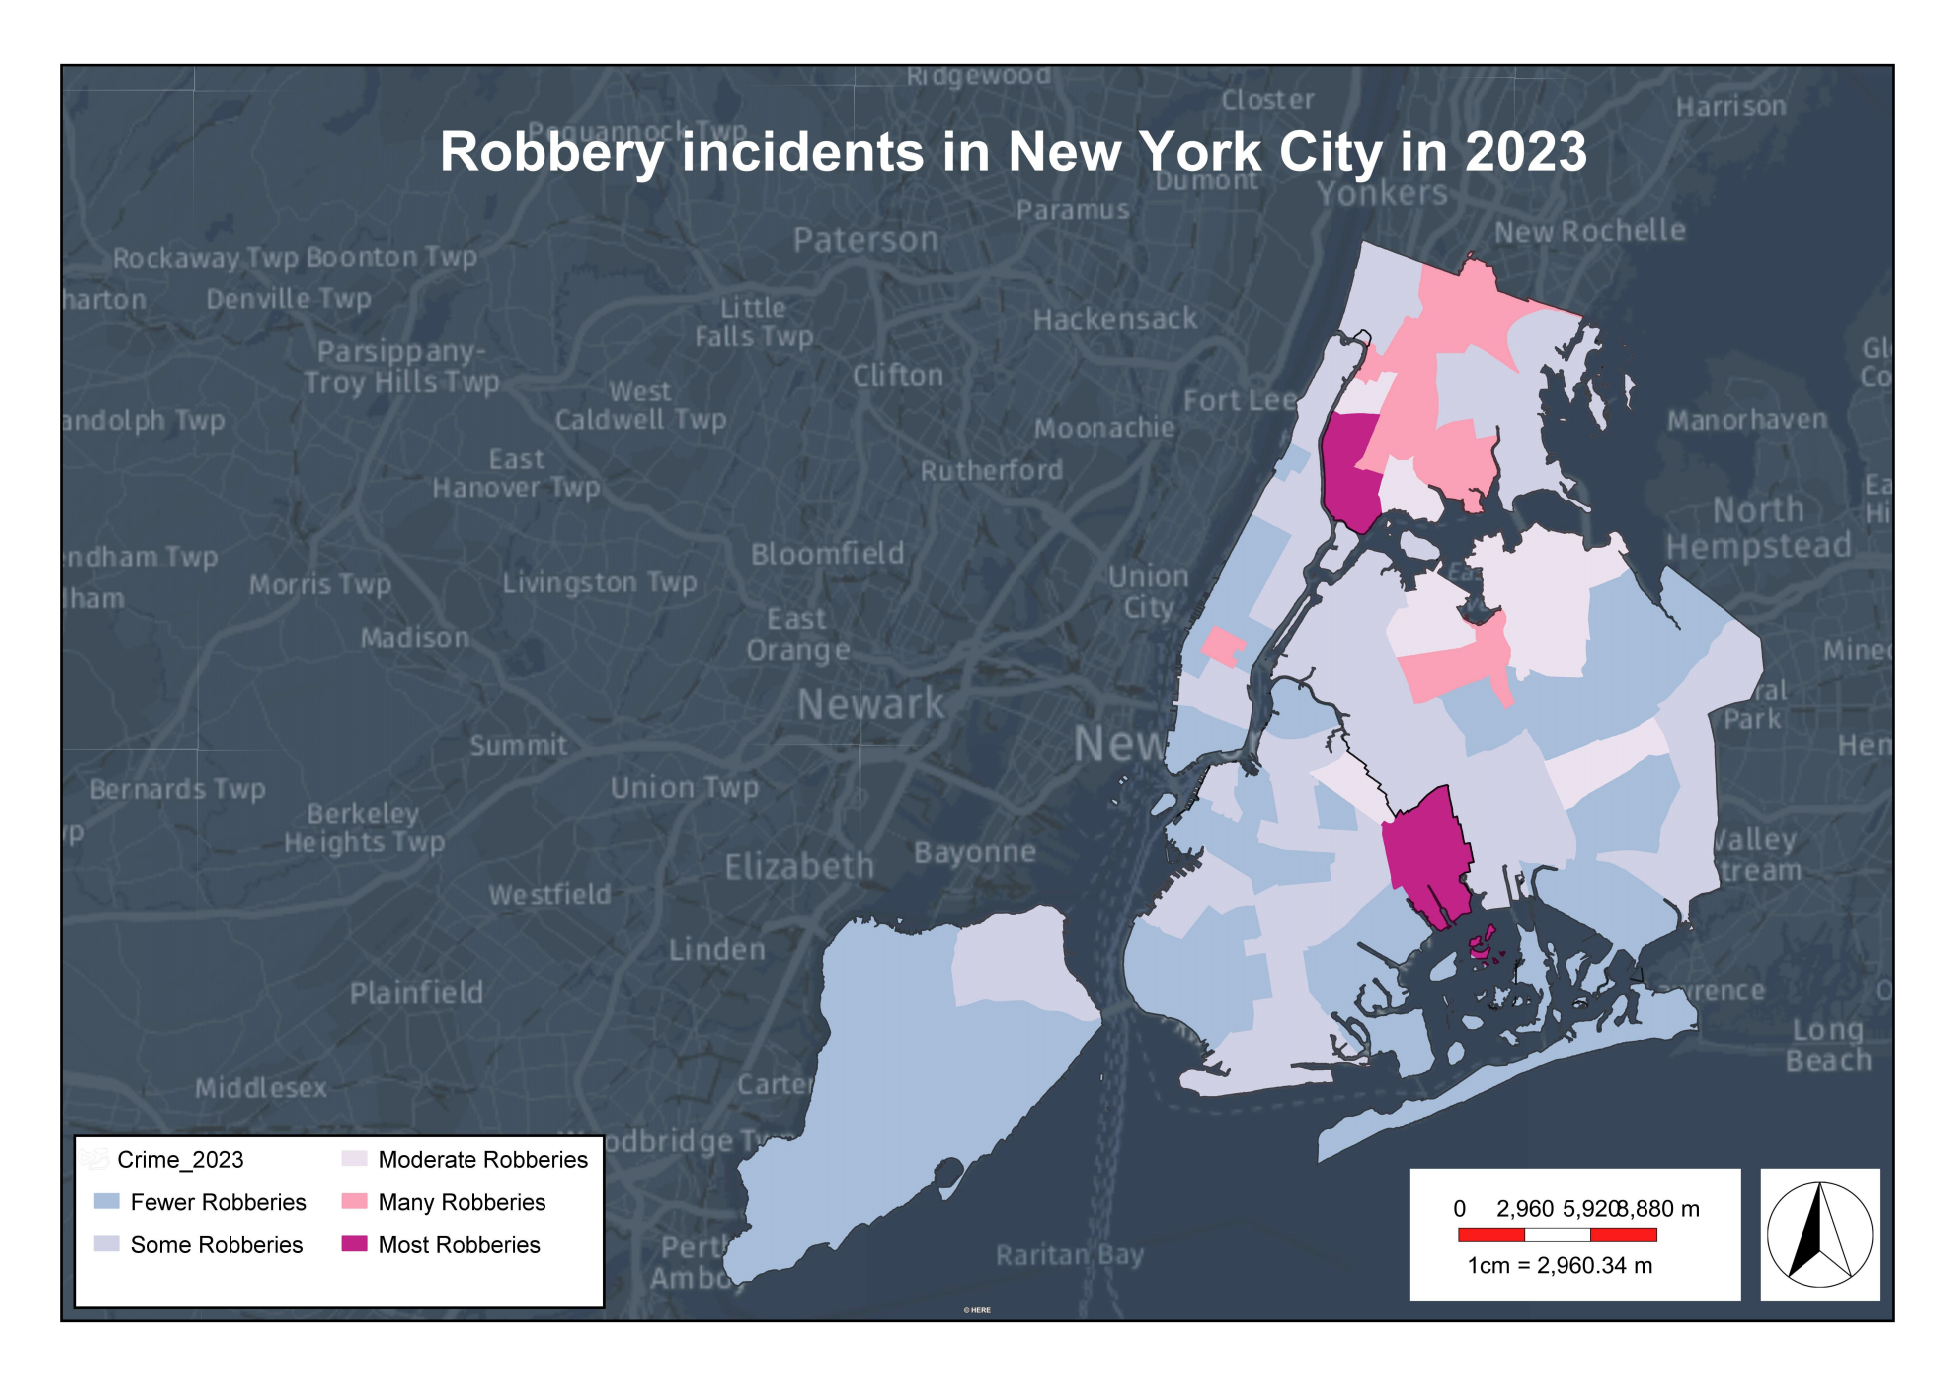
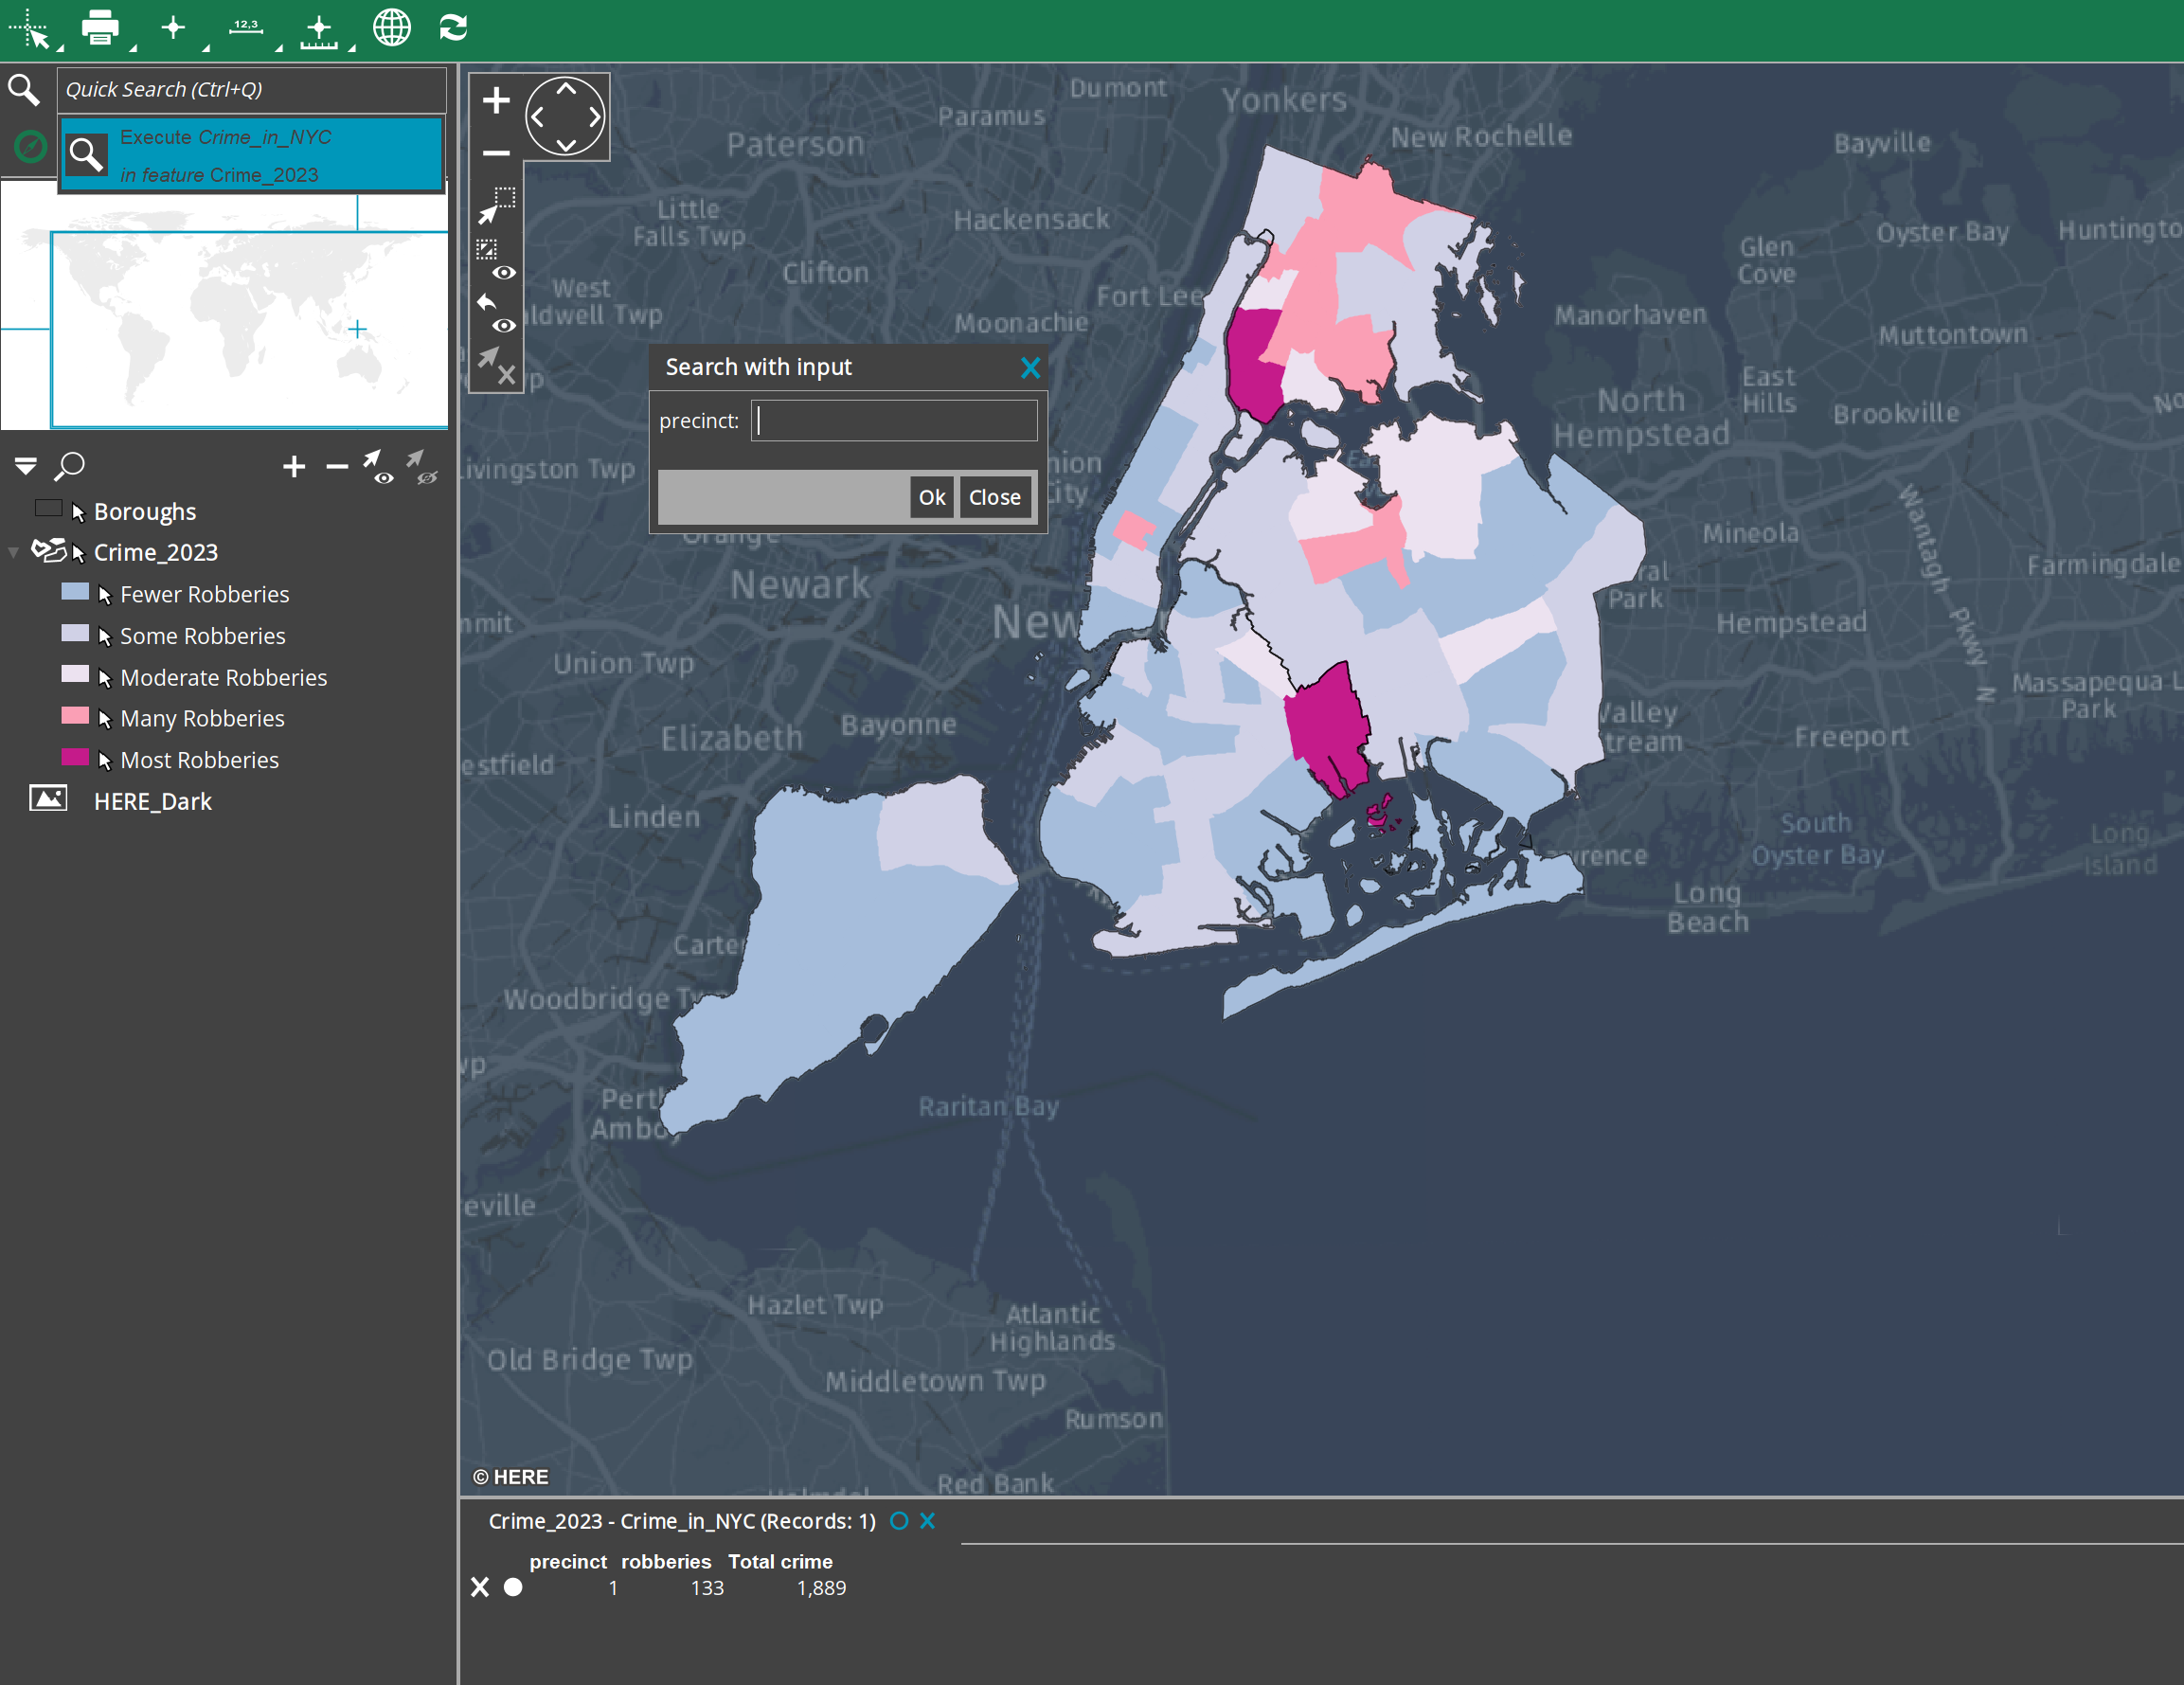
This tutorial showcases all the steps needed to create the Desktop App shown above. After this tutorial you will be able to create your own queries, print layouts and stylesets.
1. Data & Legend
To start, incorporate the vector data from the provided New York datasets into M.App Enterprise. Access your Studio account, navigate to Content in the left menu, and select Vector Data. Click on New, choose an existing connection or establish a new one, and then proceed to add the required datasets.
For this example you will need the following datasets from the NewYork database.
- Crime 2023
- Boroughs
Have a look at the post below and download the needed data.


Google Maps background
A Google Maps Geoservice will serve as background layer in this application. Create a new Geoservice, name it accordingly and use your obtained API key from the Google Maps platform. Choose Type: Roadmap and Language: English and click on Save.

2. Styleset
Navigate to the content menu and choose Styleset. Then create a new one and name it "UseCase3".

Crime 2023 layer
Once in the Style Editor, open the wizard by clicking on Generate and Graduated. From there, select the Crime 2023 layer and Robbery as the input parameters. Select 5 classes for the data ranges and adapt the colors:
#A6BDDB#D0D1E6#ECE2F0#FA9FB5#C51B8A
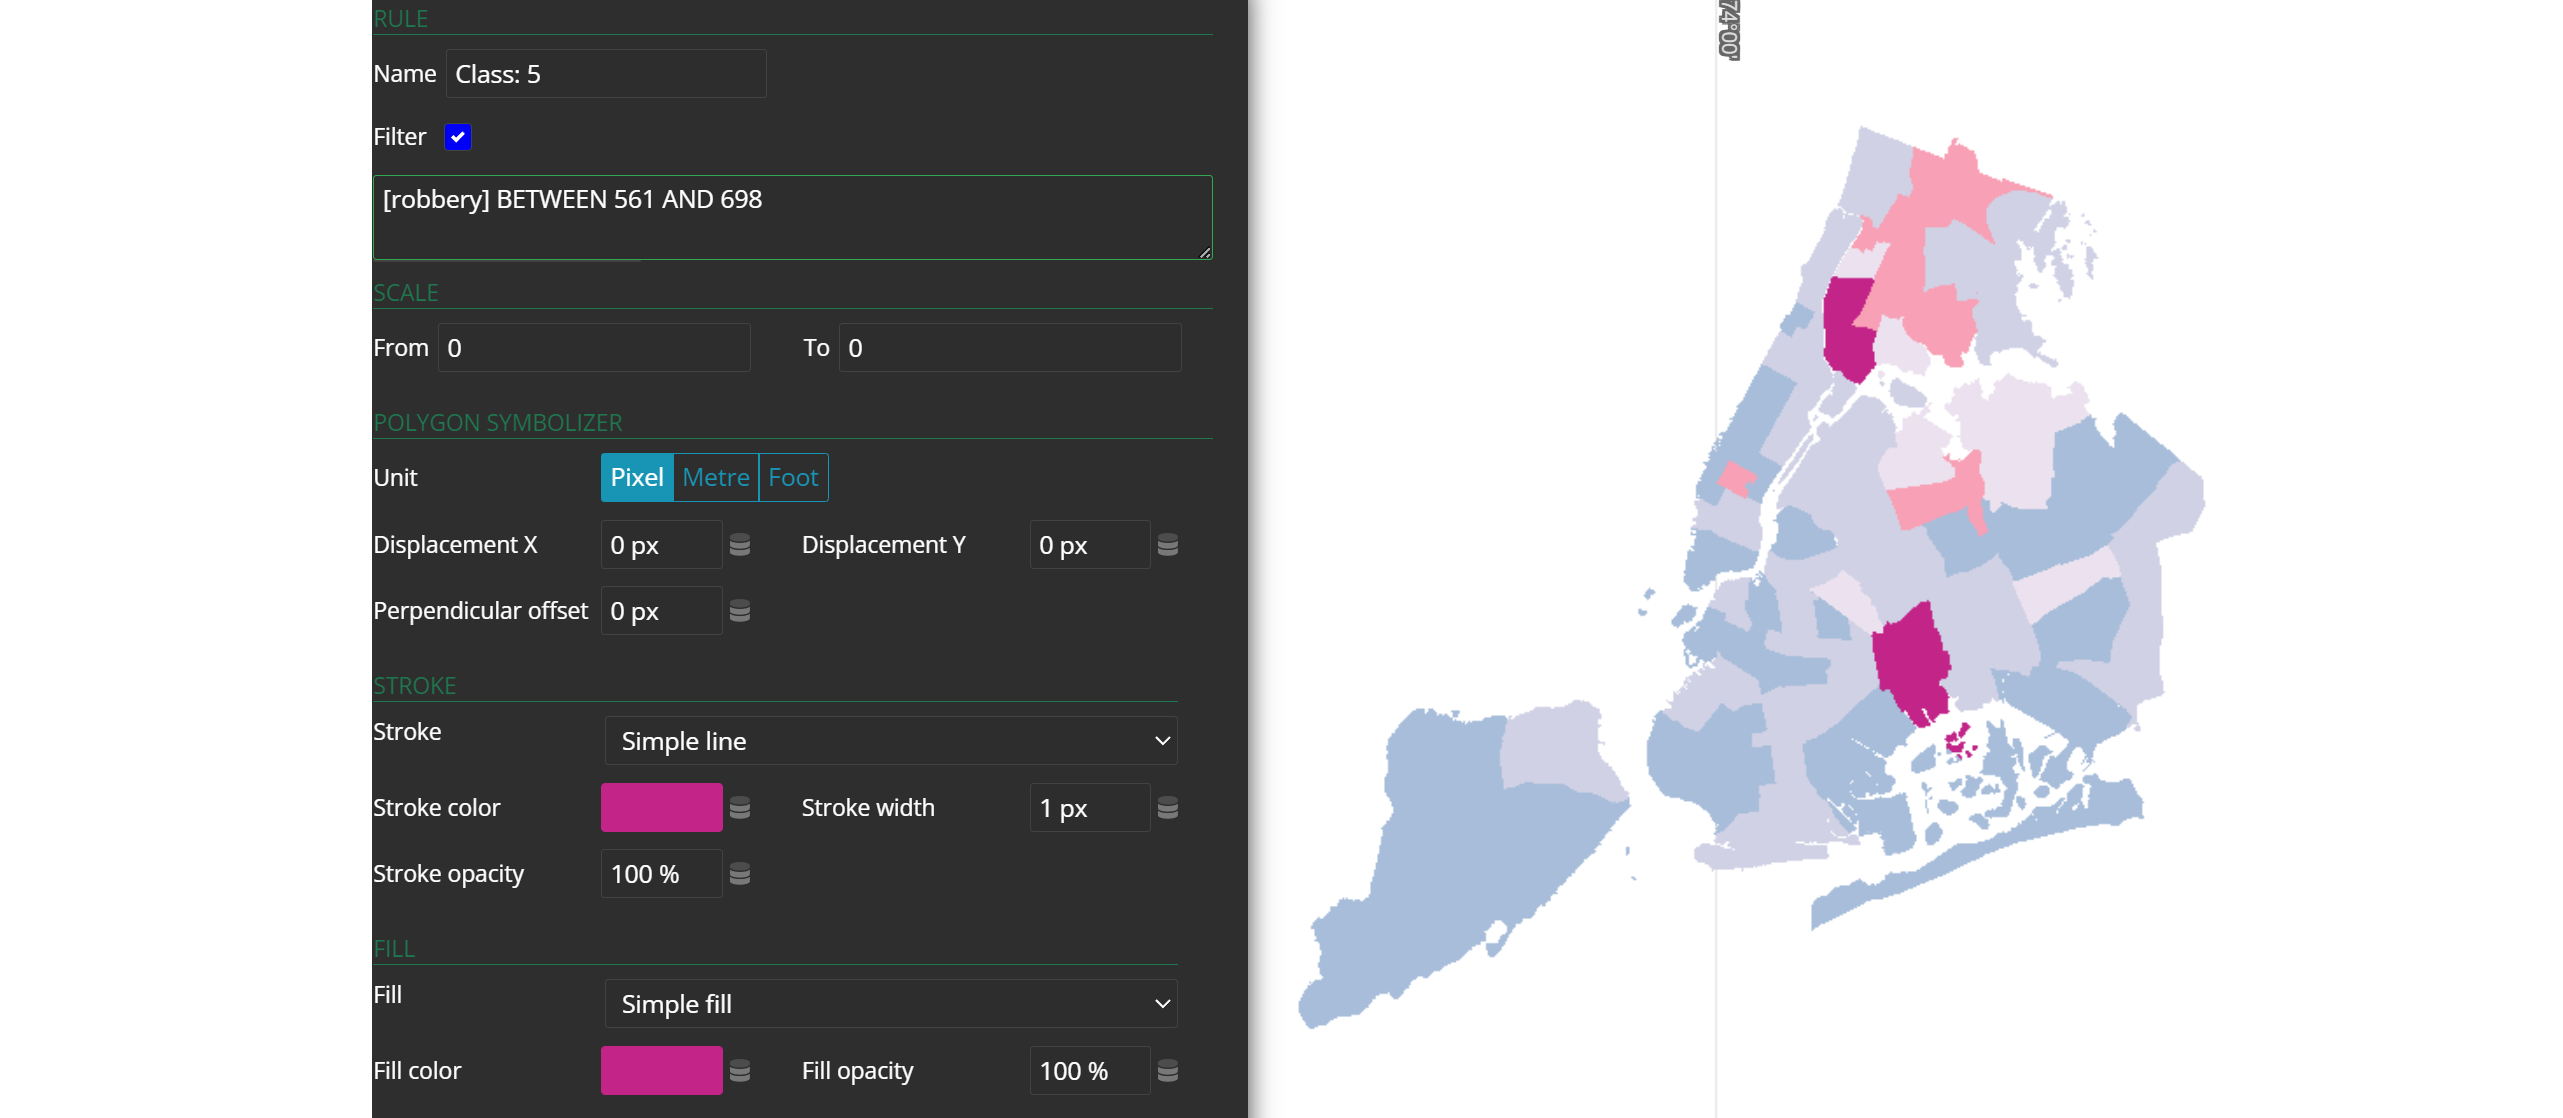
Finally, change the names of the classes to the ones in the image below.

Boroughs layer
Open the style editor and select Boroughs from the unstyled layers list. Apply a simple, conventional style to the Boroughs layer. Use a black stroke color (#010101) and a stroke width of 1 pixel. This will give the Boroughs layer a basic, standard appearance.
3. Query
A query will enable the app users to filter data directly in the desktop application.


Navigate to Desktop → Queries → New. Name your Query "Crime in NYC", choose the Crime 2023 dataset for both the query and the display dataset.
Copy the following SQL Query in the query field. Don't forget to test it, before you save it.
SELECT precinct as Precinct, robbery as Robberies, total_crime as "Total crime" from crime_2023 where precinct = {ENTITY.precinct}
4.Print Layout
To enable the users to print the map from our Crime App, we have to create a print layout. A default layout is available, but let's create a new one ;-)
To design your own print layout, navigate to Tools and click onPrint Layout. The Print Layout Editor will open and you can start with the design.
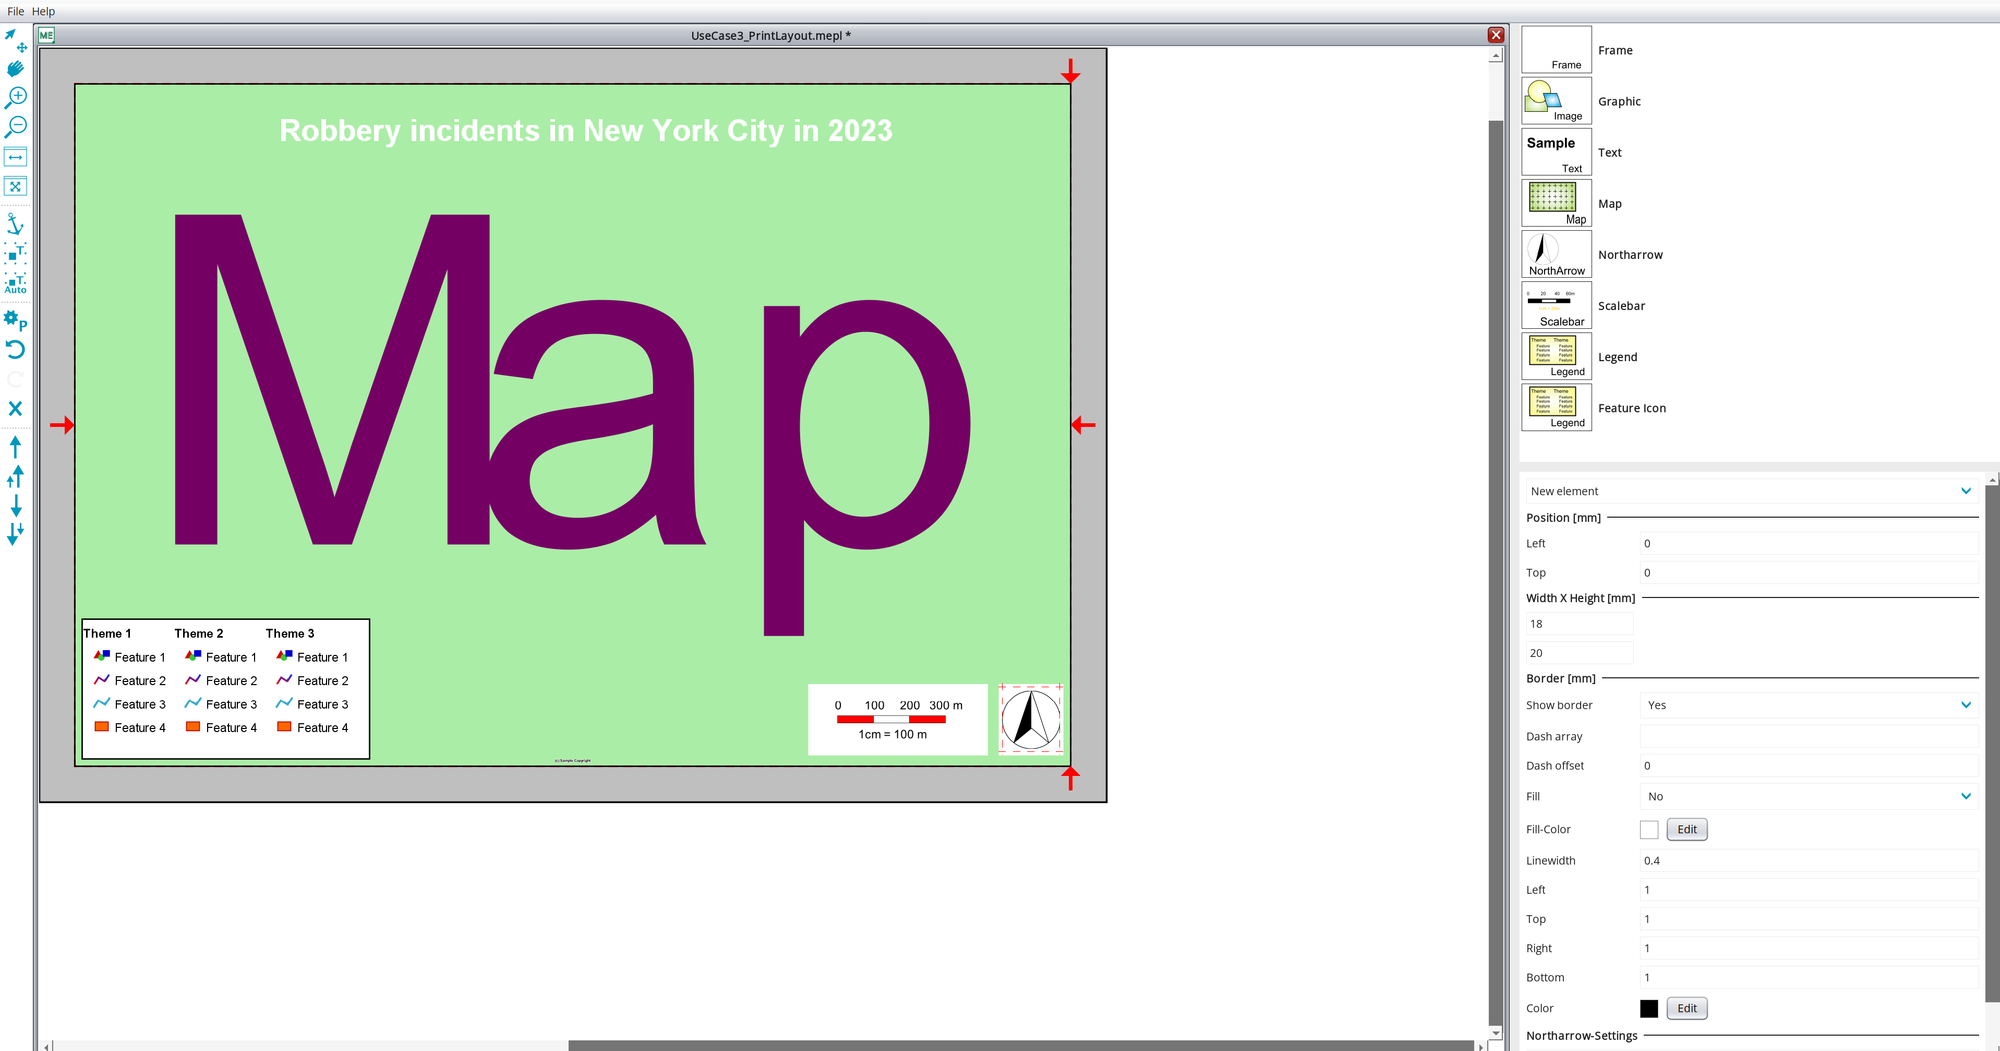
The elements on the right handside can be dragged and dropped into your print layout.
- Let's start with adding a
Map. Simply enlarge the window so that it fills the entire page. - Now drag and drop the
Northarrowelement from the left to the print layout page. Place it in the right bottom corner and leave a margin of about half a centimeter to both sides. In the settings on the right side change the dropdown toShow border: No,Fill: YesandApply.
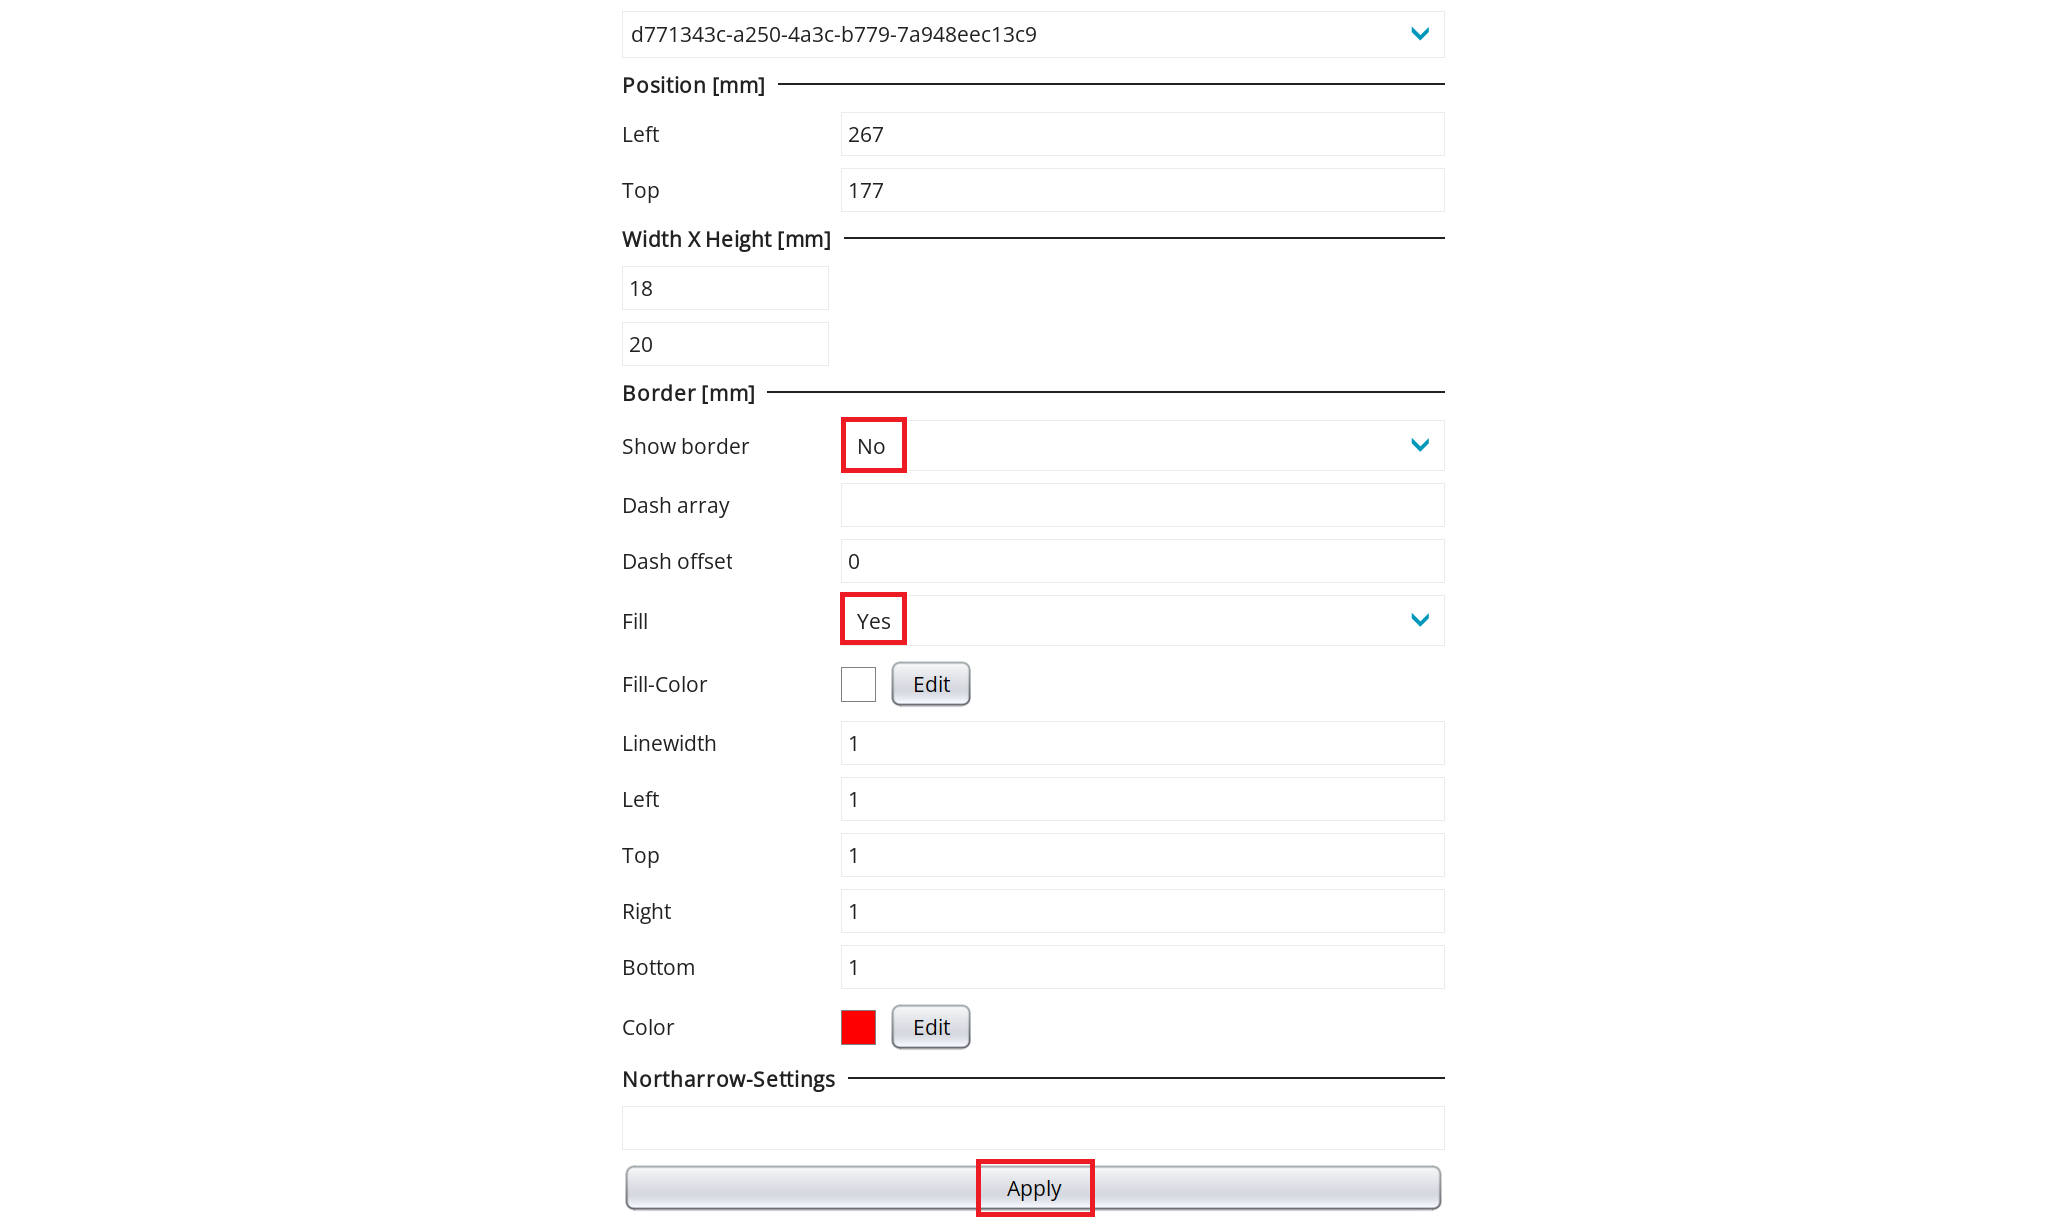
- The next element to add is a
Scalebar. Place it right next to the north arrow, set the border invisible as well, and the fill to "yes". - Add a
Legendelement and fit it to the left bottom corner with a small margin again to the sides. Adapt the size to have 3 Themes visible in the layout. - Finally, since we want to have a title for our map, add a
Textfield to the top of the layout. Again, set the border invisible.- Open an empty
word documentand write "Robbery incidents in New York City in 2023" in it. - Change the
fonttoSegoe UI, thefont sizeto24and change thecolortowhite. - Copy the text and paste it into the text field under Text-Settings. Click on
Applyto make the changes effective.
- Open an empty

Having added and arranged all the elements, your print layout is now ready to use. Save the file on your local drive. Now go back to Studio and navigate to Desktop -> Print Layouts

Upload the previously created Print Layout file from your drive here and assign a name like "UseCase3 PrintLayout". Save it and proceed with the next step.
5. Desktop App
Now that the components for our App are completed, we can put the pieces of the puzzle together.
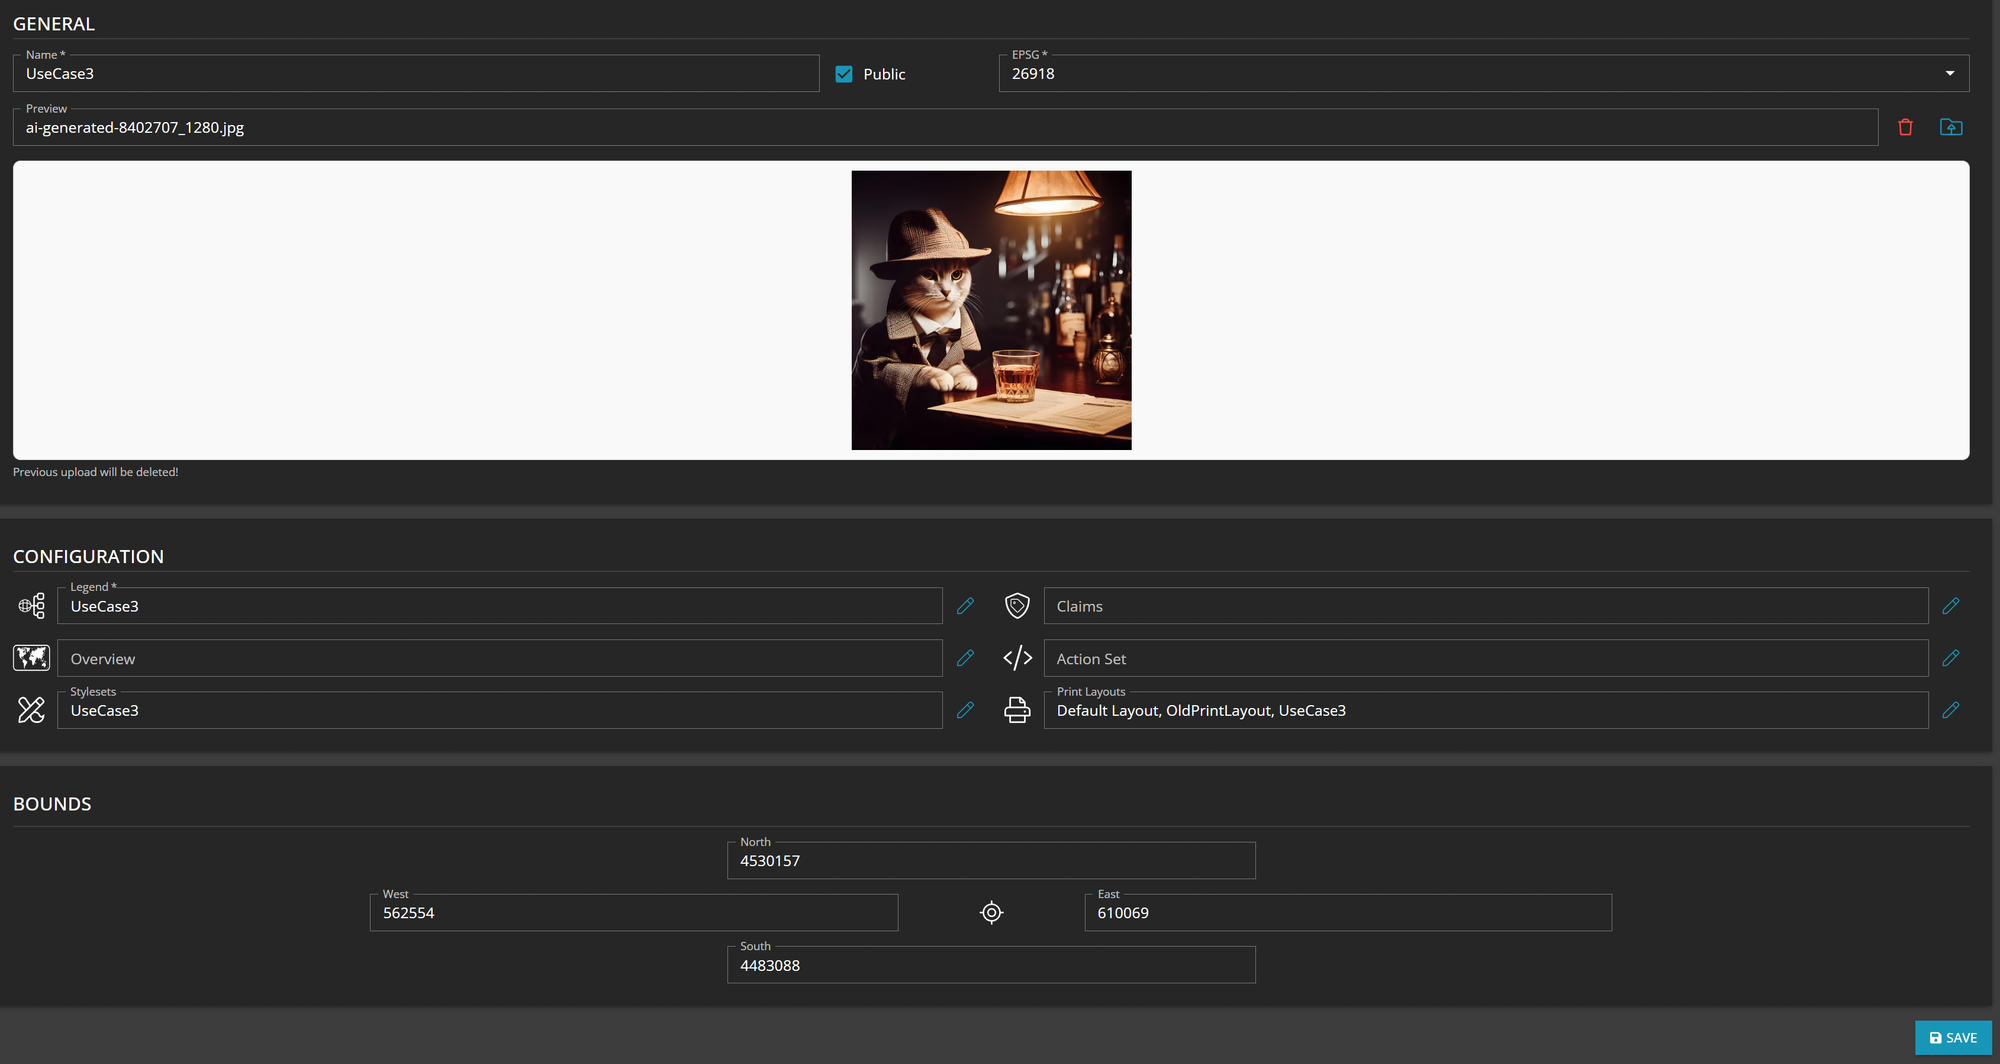
Choose the previously created Legend, Styleset and Print Layout, assign a Name and an EPSG code and click on save.
6. App User options
This paragraph serves to show the possibilities for users in the App.
Filtering
Due to the Query you have created previously, app users can now select certain precincts by their id.
In the desktop app, simply click inside the Quick Search field. A dropdown with your saved query will appear. To run the query, just double-click it. This brings up an input field where the user can enter any precinct ID.
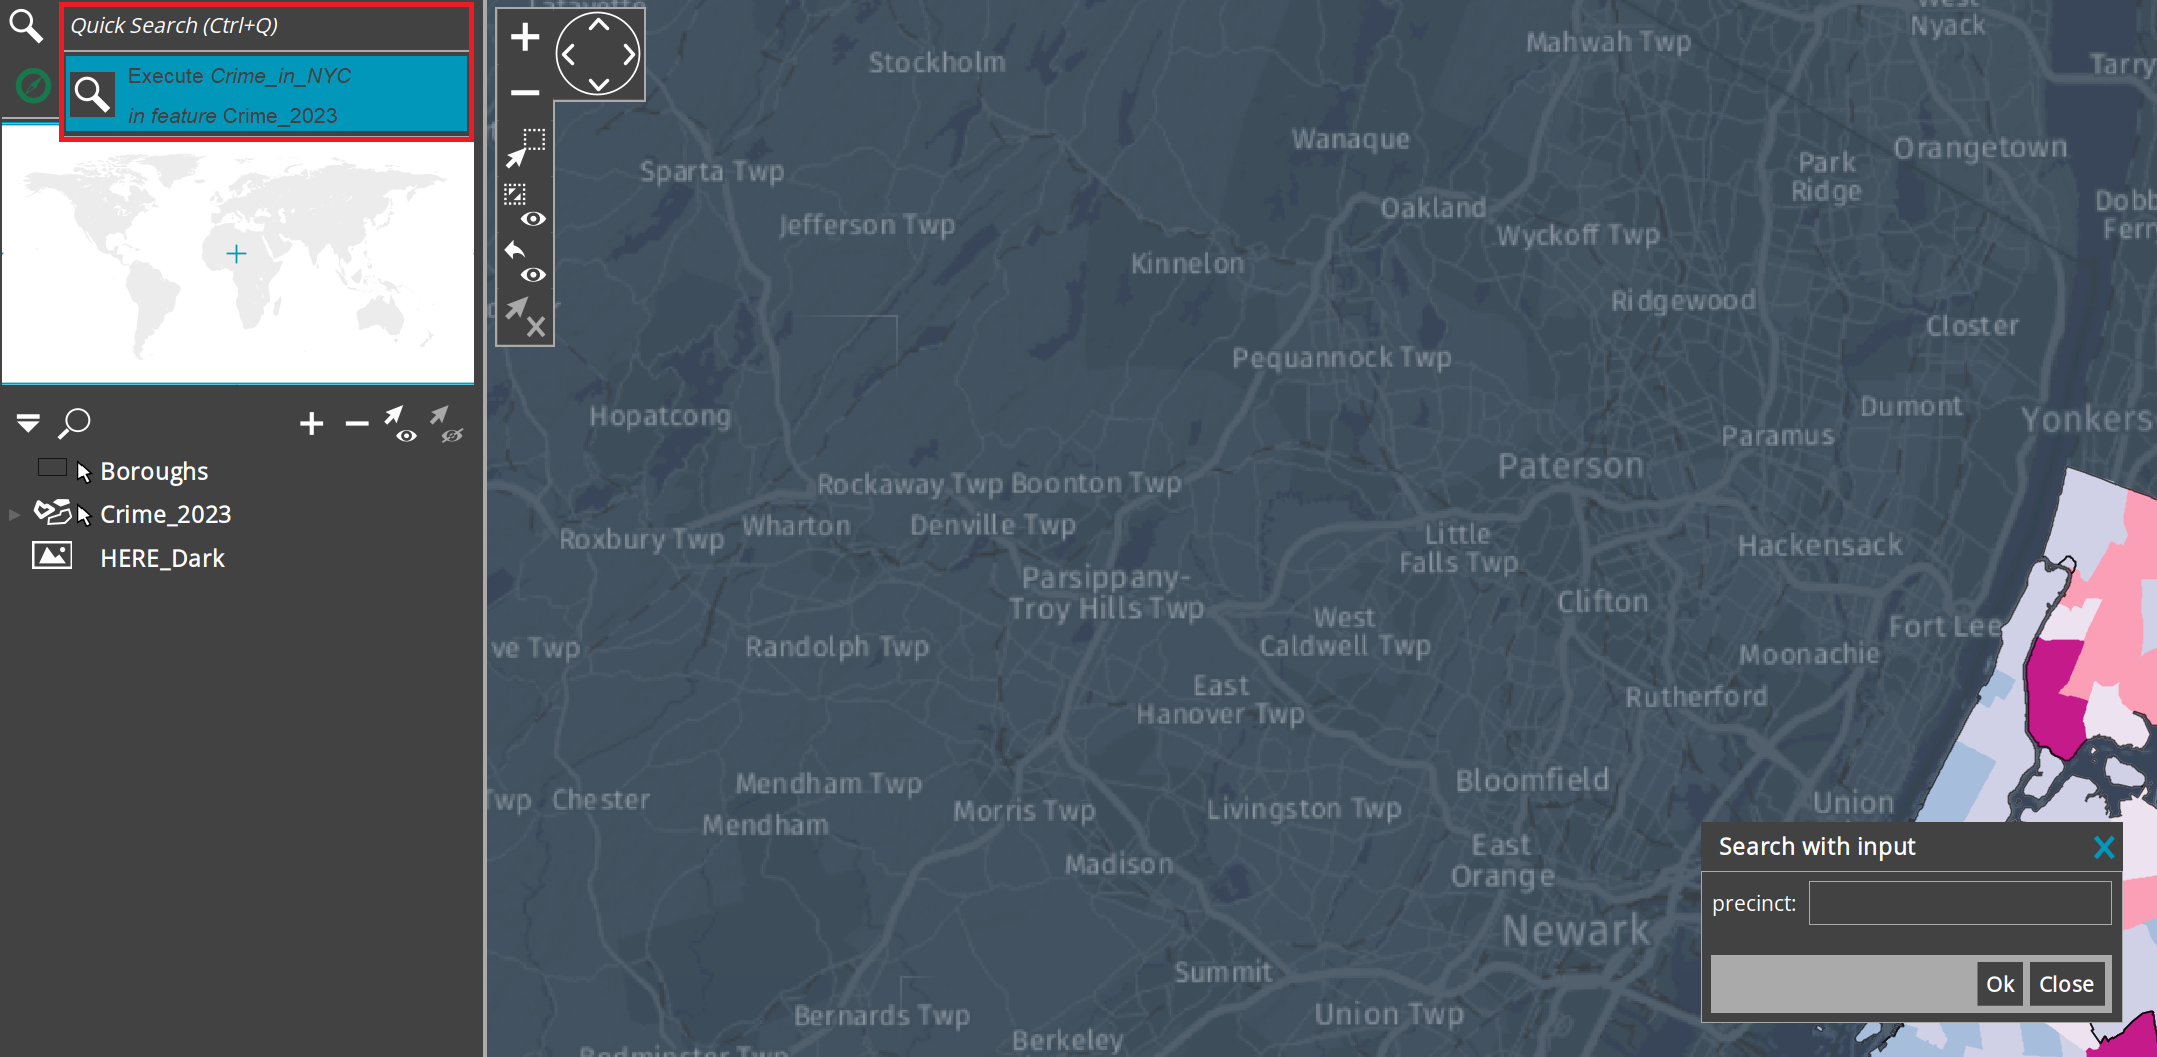
By clicking OK, a table with the dataset and the attributes defined in the query will appear at the bottom of the screen.

Printing
To make use of the printing option just click on the printer icon in the toolbar on top of your desktop app.

The standard print settings window will open.
When you click OK, the print layout settings will open. The green area marks the area of the map view. You can adjust the map section by zooming in or out or moving the area. In our case, we move the map a little to the left and up so that the legend and title do not obscure the contents of the map.
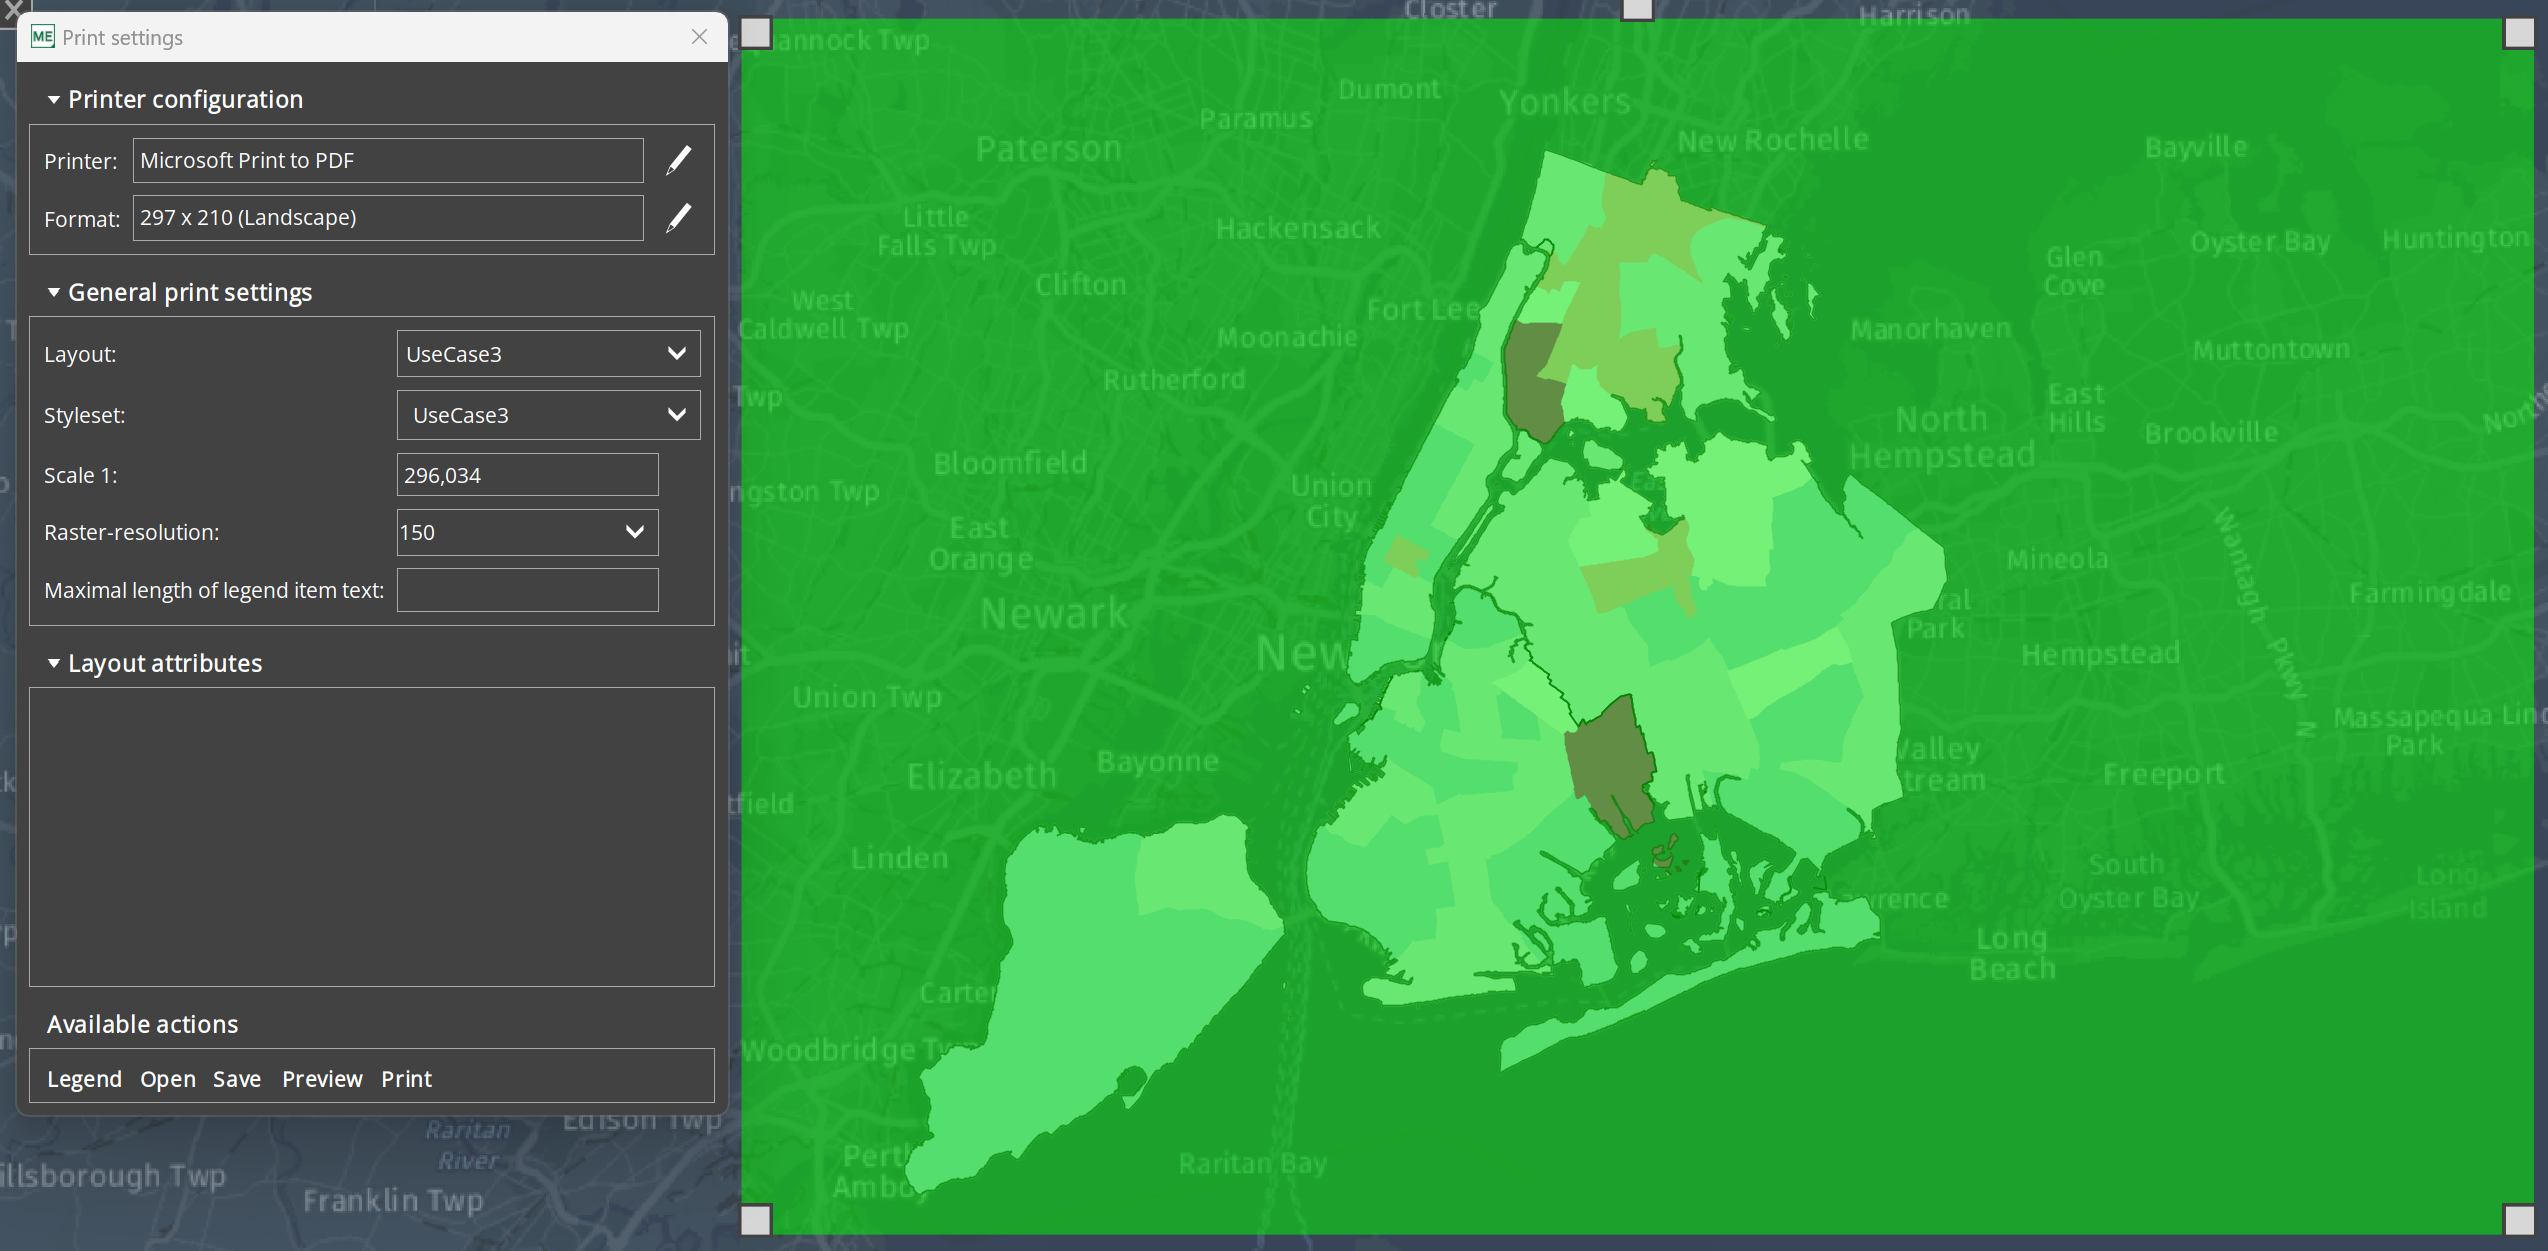
Click on Legend to open a panel with all the legend entries. With a double-click on "Boroughs" and "HERE_Dark" you can set these layers invisible on the legend.

To print your map or create a PDF that matches the image below, select the Print option.
