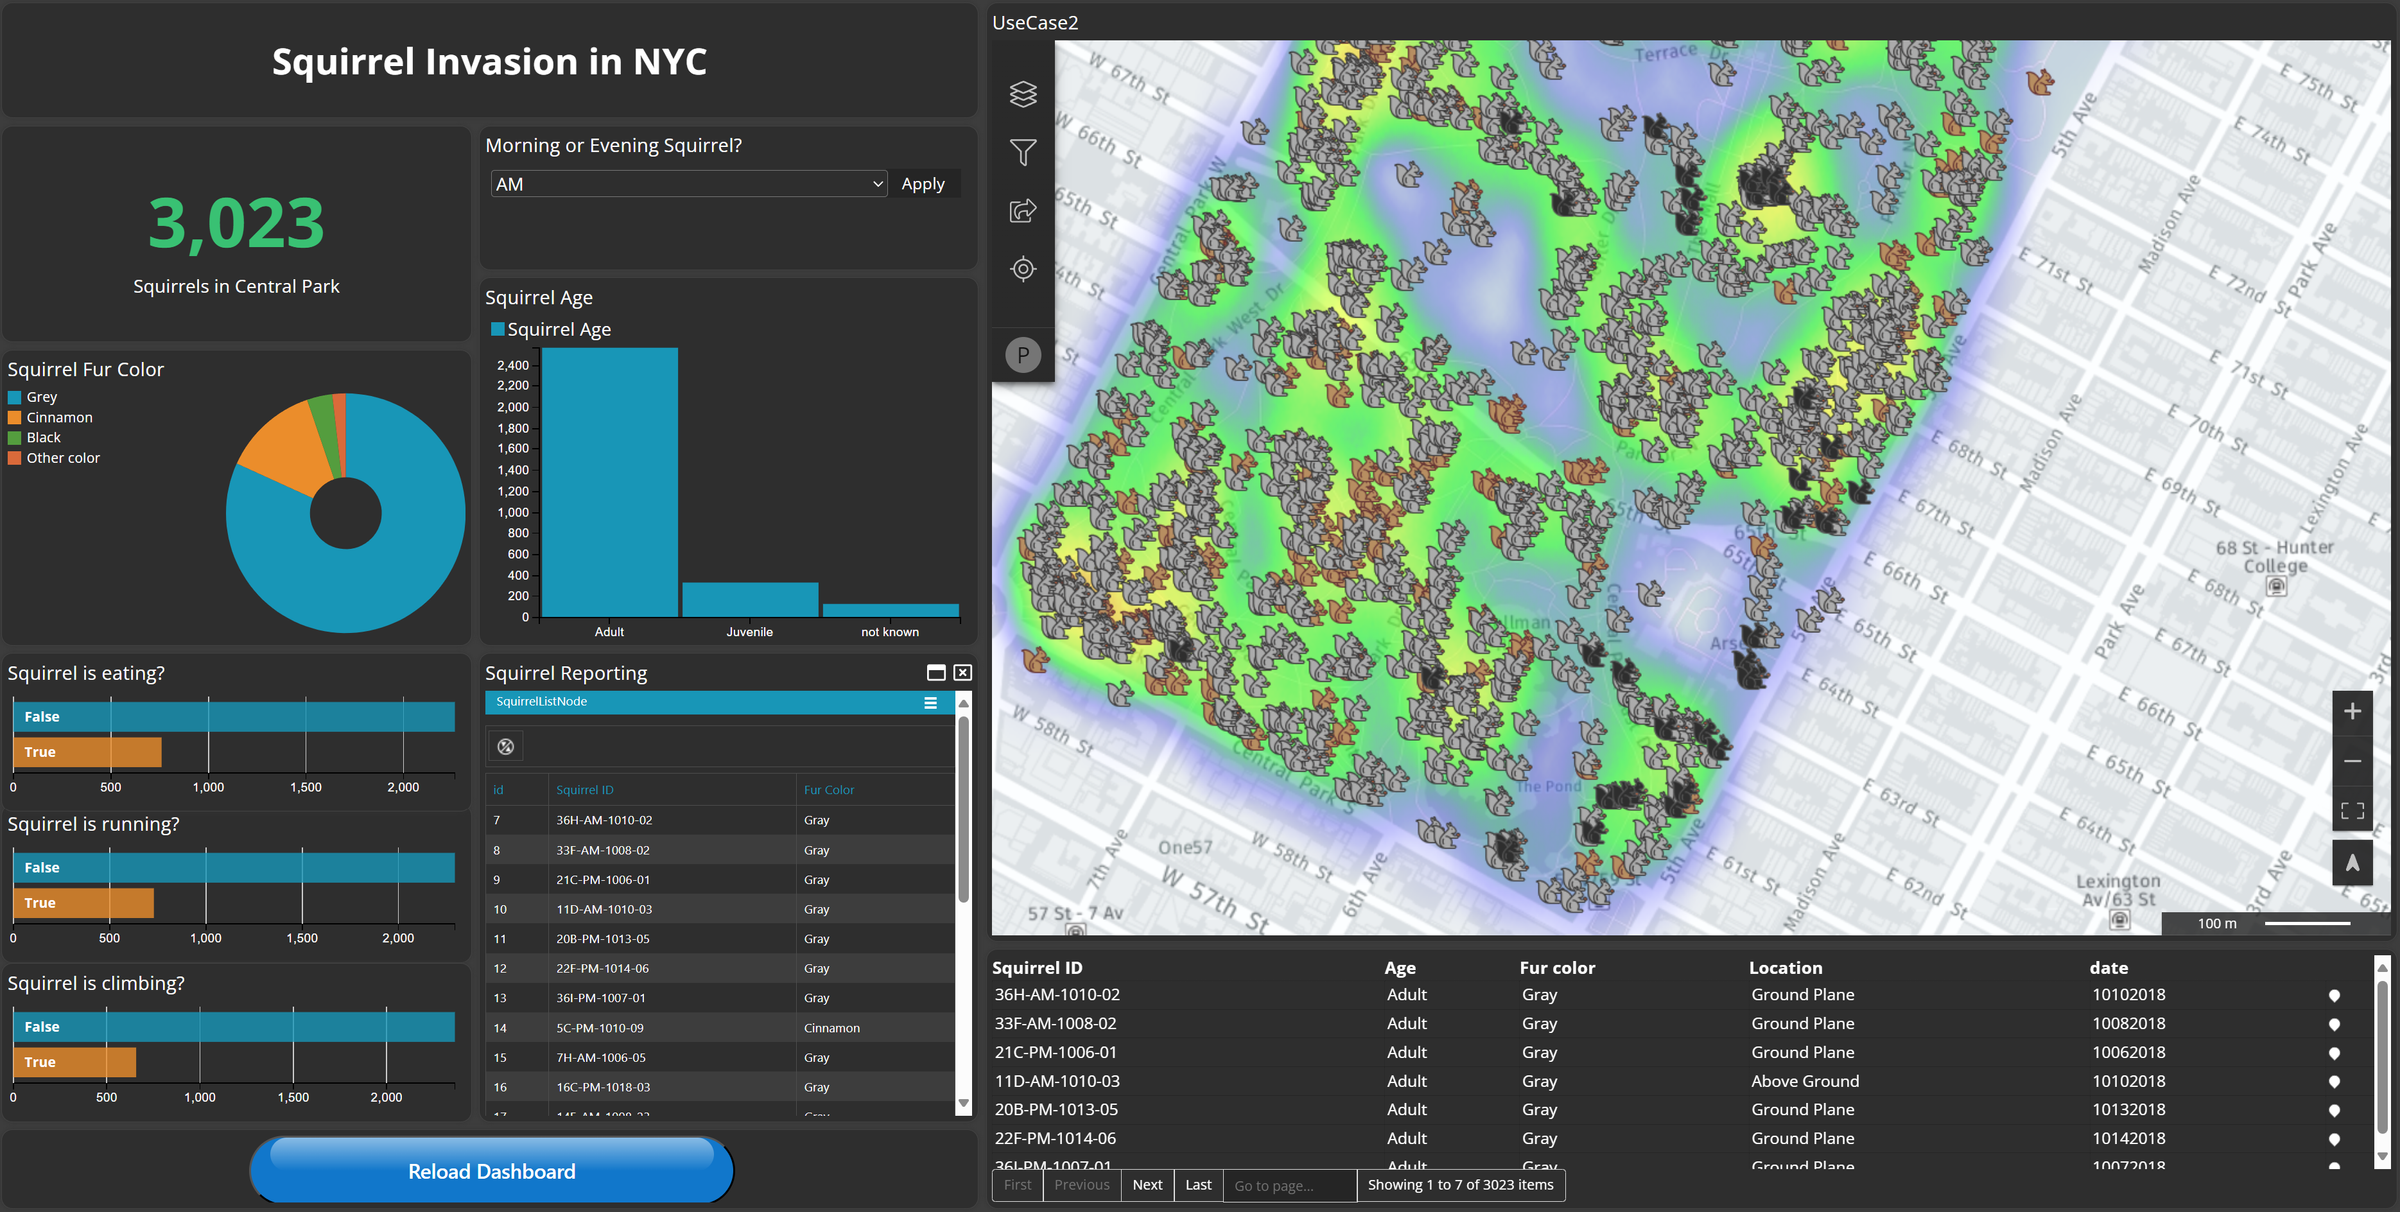
In this tutorial, we will lead you trough all the necessary steps to create the exact Dashboard shown in the image above. We will use different widgets, create a workflow and simply make a nice Dashboard.
1. Data & Legend
To begin, incorporate vector data from the provided New York datasets into M.App Enterprise. Access your Studio account, navigate to Content in the left menu, and opt for Vector Data. Click on New, choose an existing connection or establish a new one, then proceed to add the needed datasets.
For this example, you will need the following dataset from the NewYork database.
-
Boroughs
-
Squirrel Census
-
Open Street Map as background layer
Have a look at the post below and download the necessary datasets.


Legend
Your legend should now look like in the image below. Rename the layers if necessary.

2. Styleset
To style the squirrel dataset in your dashboard map, start by creating a new styleset named UseCase2.
Boroughs layer
Open the style editor and select Boroughs from the unstyled layers list. Apply a simple, conventional style to the Boroughs layer. Use a black stroke color (#010101) and a stroke width of 1 pixel. This will give the Boroughs layer a basic, standard appearance.

Squirrel Census layer
Use an icon
For the styling of the squirrel census layer, we have downloaded some free svg icons representing a squirrel. We have colored them in cinnamon, black and grey to represent the different squirrel types.

Now to proceed, you have to select the squirrel census layer from the list of unstyled layers. Add two rules in the rule navigator and for each a point symbolizer. Then start with the first rule, and apply a filter based on the squirrels' fur color:
[primary_fur_color] = "Cinnamon"
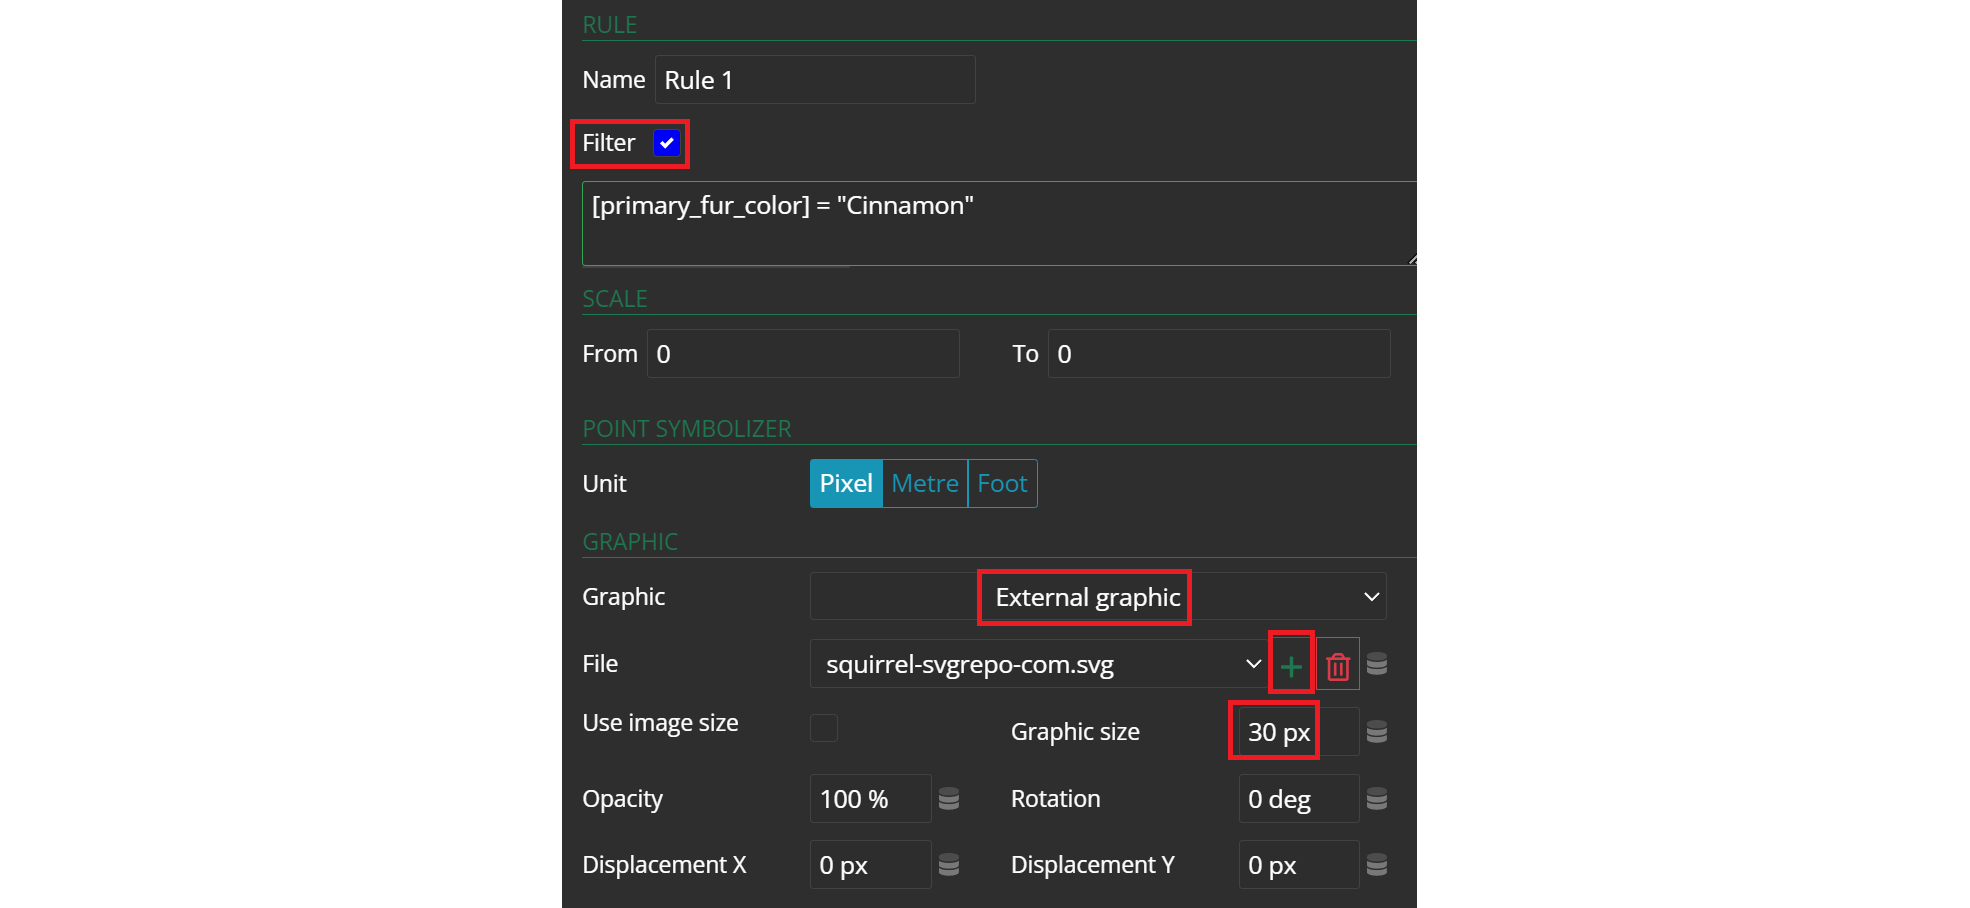
To proceed, select External graphic and then click on the plus icon to upload the first SVG icon from your drive. Adjust the graphic size to 30px and then move on to the next rule.
Don't forget to save it!
3. Workflow
Navigate to Workflows in the Content section of your Studio menu. Create a new workflow, name it and specify the data connection for it.
Access the Workflow Editor and start building your worklow.
Squirrel List
Create a new Node of type List by dragging and droping it under the root node. When prompted for an ID, enter SquirrelListNode. Your flowchart will look similar to the one below. Click on the pen icon to edit this list node.

You will be directed to the view shown below.
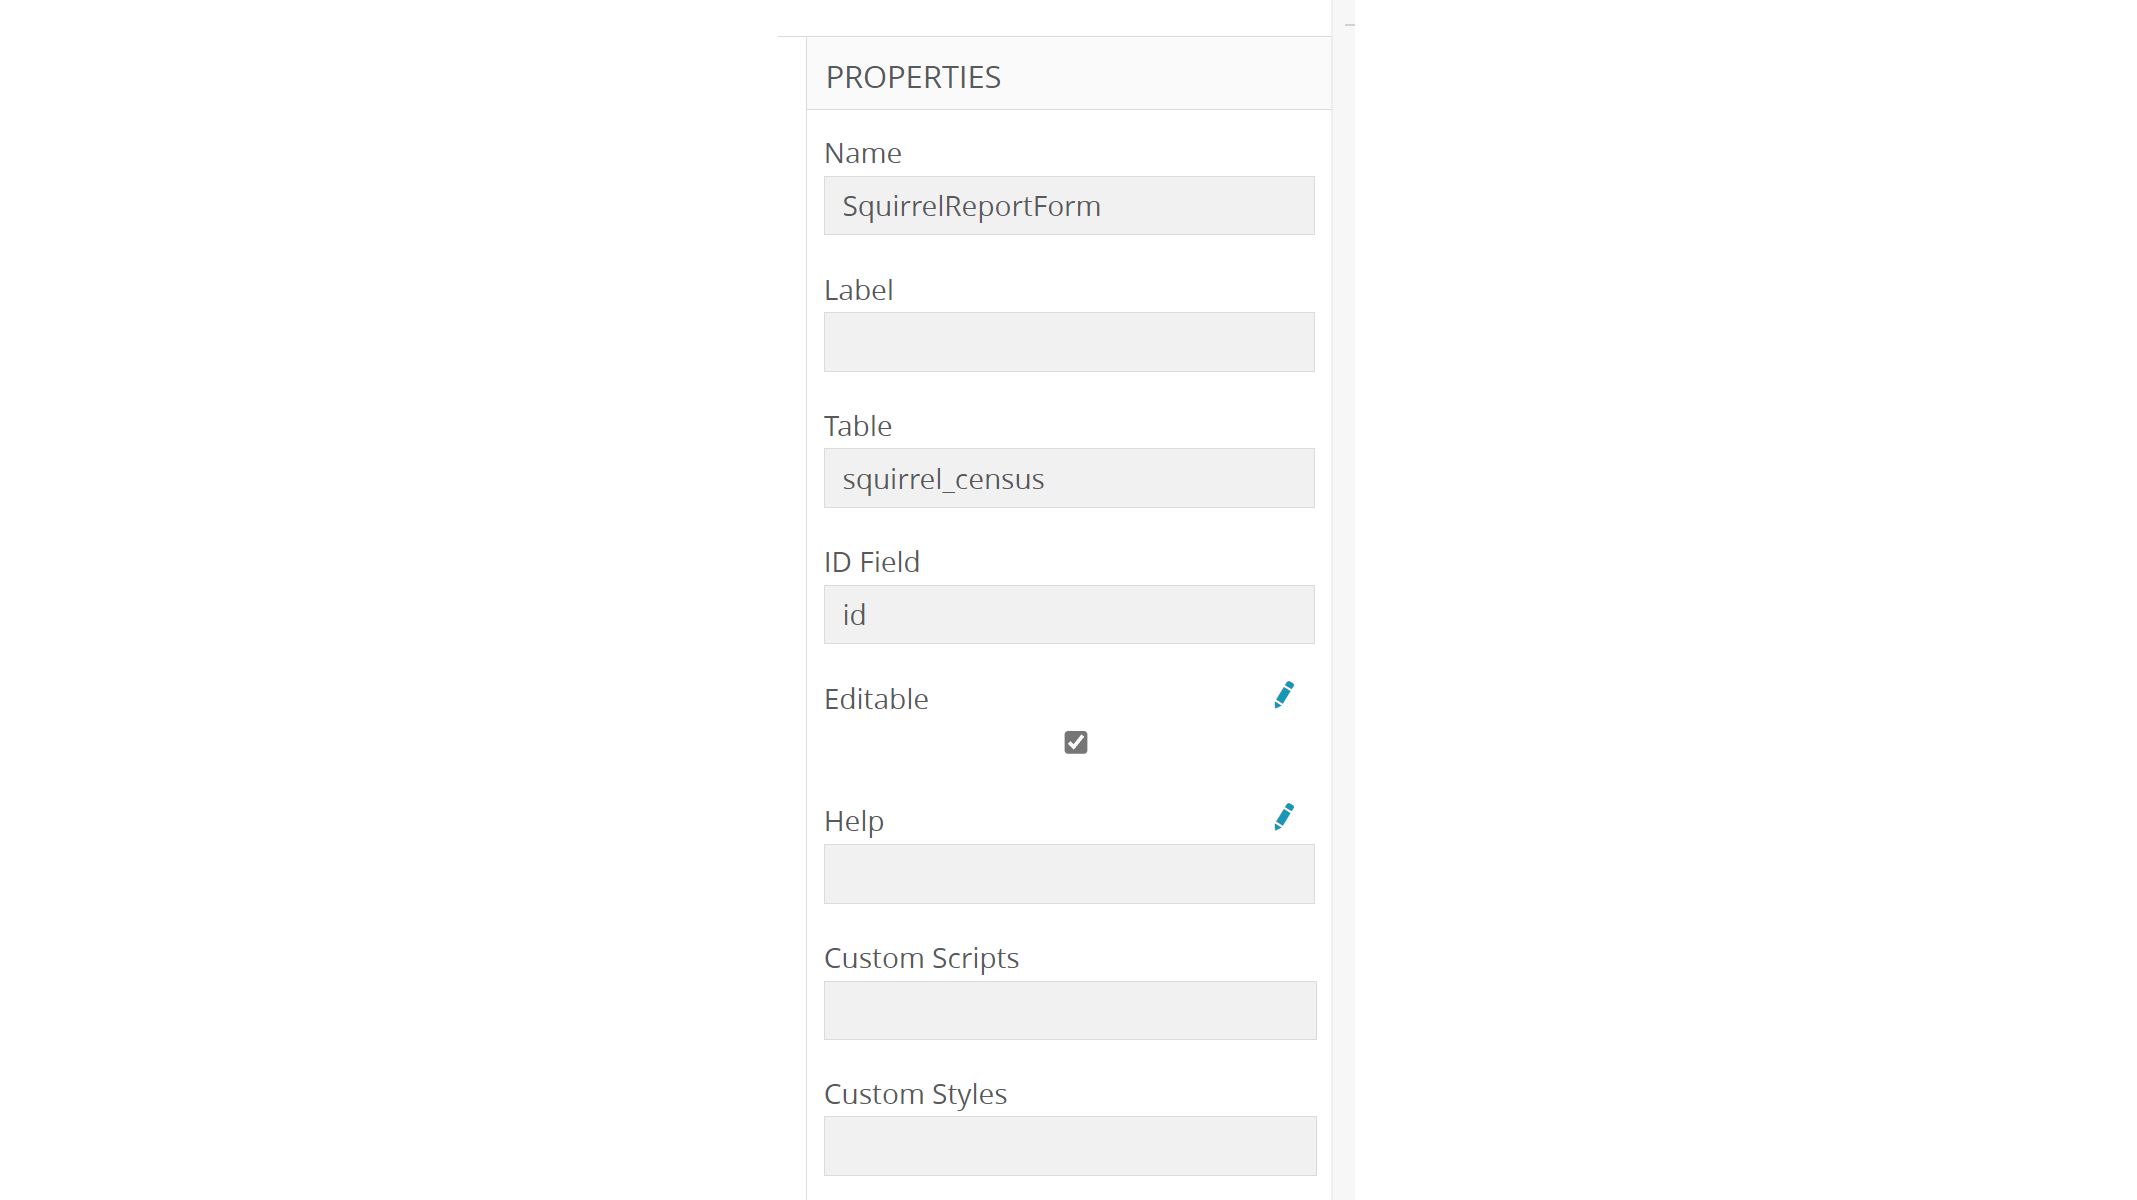
First, modify the properties of the list: change the name to SquirrelList, specify the appropriate table squirrel_census and set the ID field: id.
Next, drag and drop list elements of type column into the SquirrelList. In our example, we want to include the ID, the squirrel ID (which serves as a name), and the fur color from the attributes of the squirrel_census table.
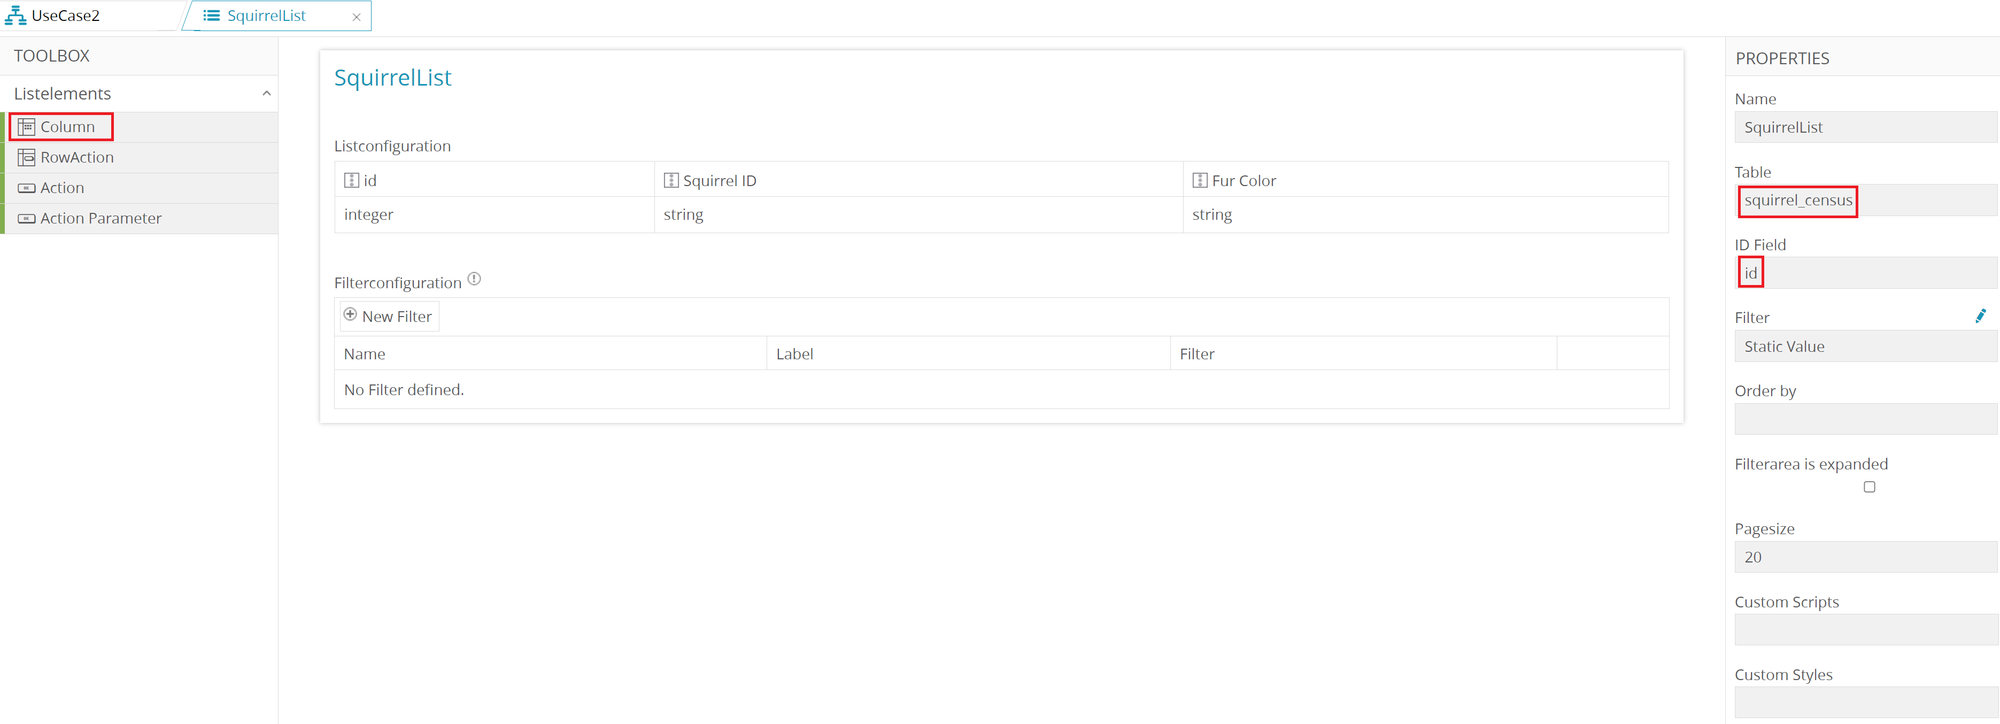
Further on, edit the columns in the list configuration. Click on one column, change their name and datatype as indicated in the table below.
| Column name | Label | Datatype | Hidden |
|---|---|---|---|
| id | - | integer |
Yes |
| unique_squirrel_id | Squirrel ID | String |
No |
| primary_fur_color | Fur color | String |
No |
Don't forget to save the changes!
Squirrel Sightings Form
Let's go back to the node overview to create a form node. Drag and drop a form node from the left menu into the workflow chart. Name it SquirrelSightingsNode and edit it by clicking on the pencil icon.

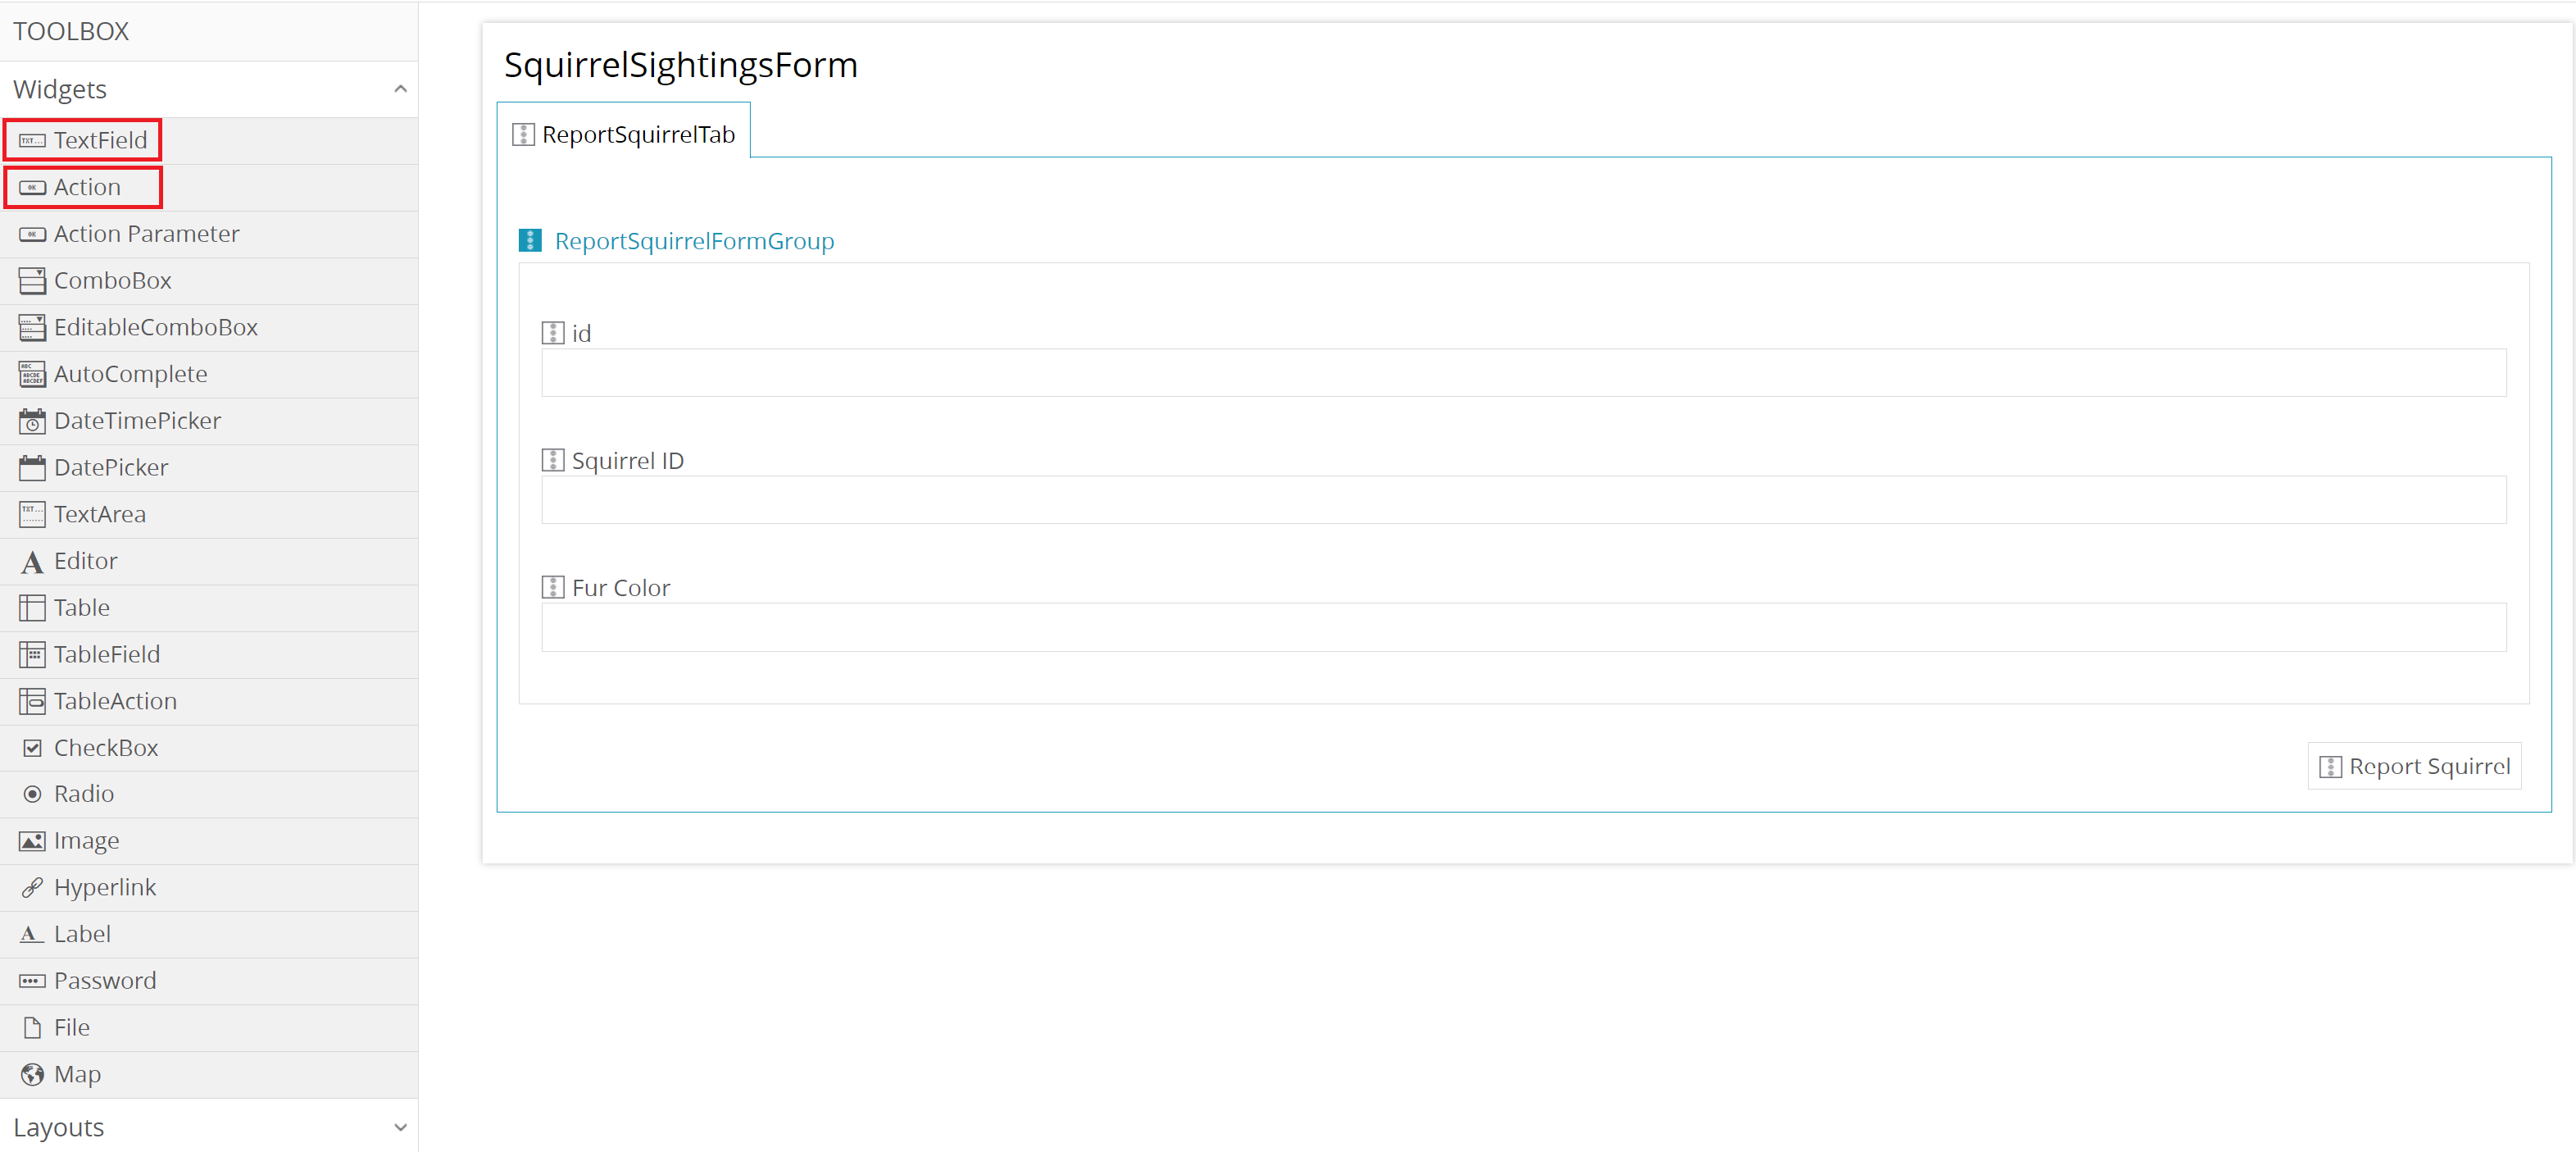
Once you are in the editor view of the form node, start with renaming:
- NewForm1 ->
ReportSightingsForm
Don't forget to add the table and its id in the properties of the form.
- NewTabPage1 ->
ReportSquirrelTab - NewGroup1 ->
ReportSquirrelFormGroup
Then, drag and drop three widgets of type Textfield into the ReportSquirrelTab, which will be the input fields in the work flow. An Action widget is needed well in the form which will serve as submit button. Now edit the individual fields and the button:
| Column name | Label | Datatype | Visible |
|---|---|---|---|
| id | - | integer |
No |
| unique_squirrel_id | Squirrel ID | String |
Yes |
| primary_fur_color | Fur color | String |
Yes |
| Name | Label |
|---|---|
| reportSquirrel | Report Squirrel |
For the button, you need to specify which action happens on it. Since we want to digitize new squirrels and add them to our list, we need to enter the following JavaScript code in the field called action.
SC.digitize('squirrel_census', {commands: ['GE_NEWPOINT'], startOnLoad: 'GE_NEWPOINT'},[])
Navigation from list node to form node
To ensure the workflow proceeds seamlessly by opening the current squirrel list and then moving to the form node for reporting a new squirrel, we need to create an additional action button that navigates between these nodes.
Edit the SquirrelList again, drag an action from the left toolbox menu and drop it to the list configuration. Click on the new button, name it, label it and open the action input field.
| Name | Label |
|---|---|
| reportNewSquirrel | Report a new Squirrel |
In the JavaScript section of the action field enter the following code:
IG.navigate('SquirrelSightingsNode')
So that you can get back to the list in the workflow after the input form, change the settings of the SquirrelSightingsNode. Choose the appropriate Follow Node just like in the image below.

Save your changes and your workflow is good to go.

4. Map View
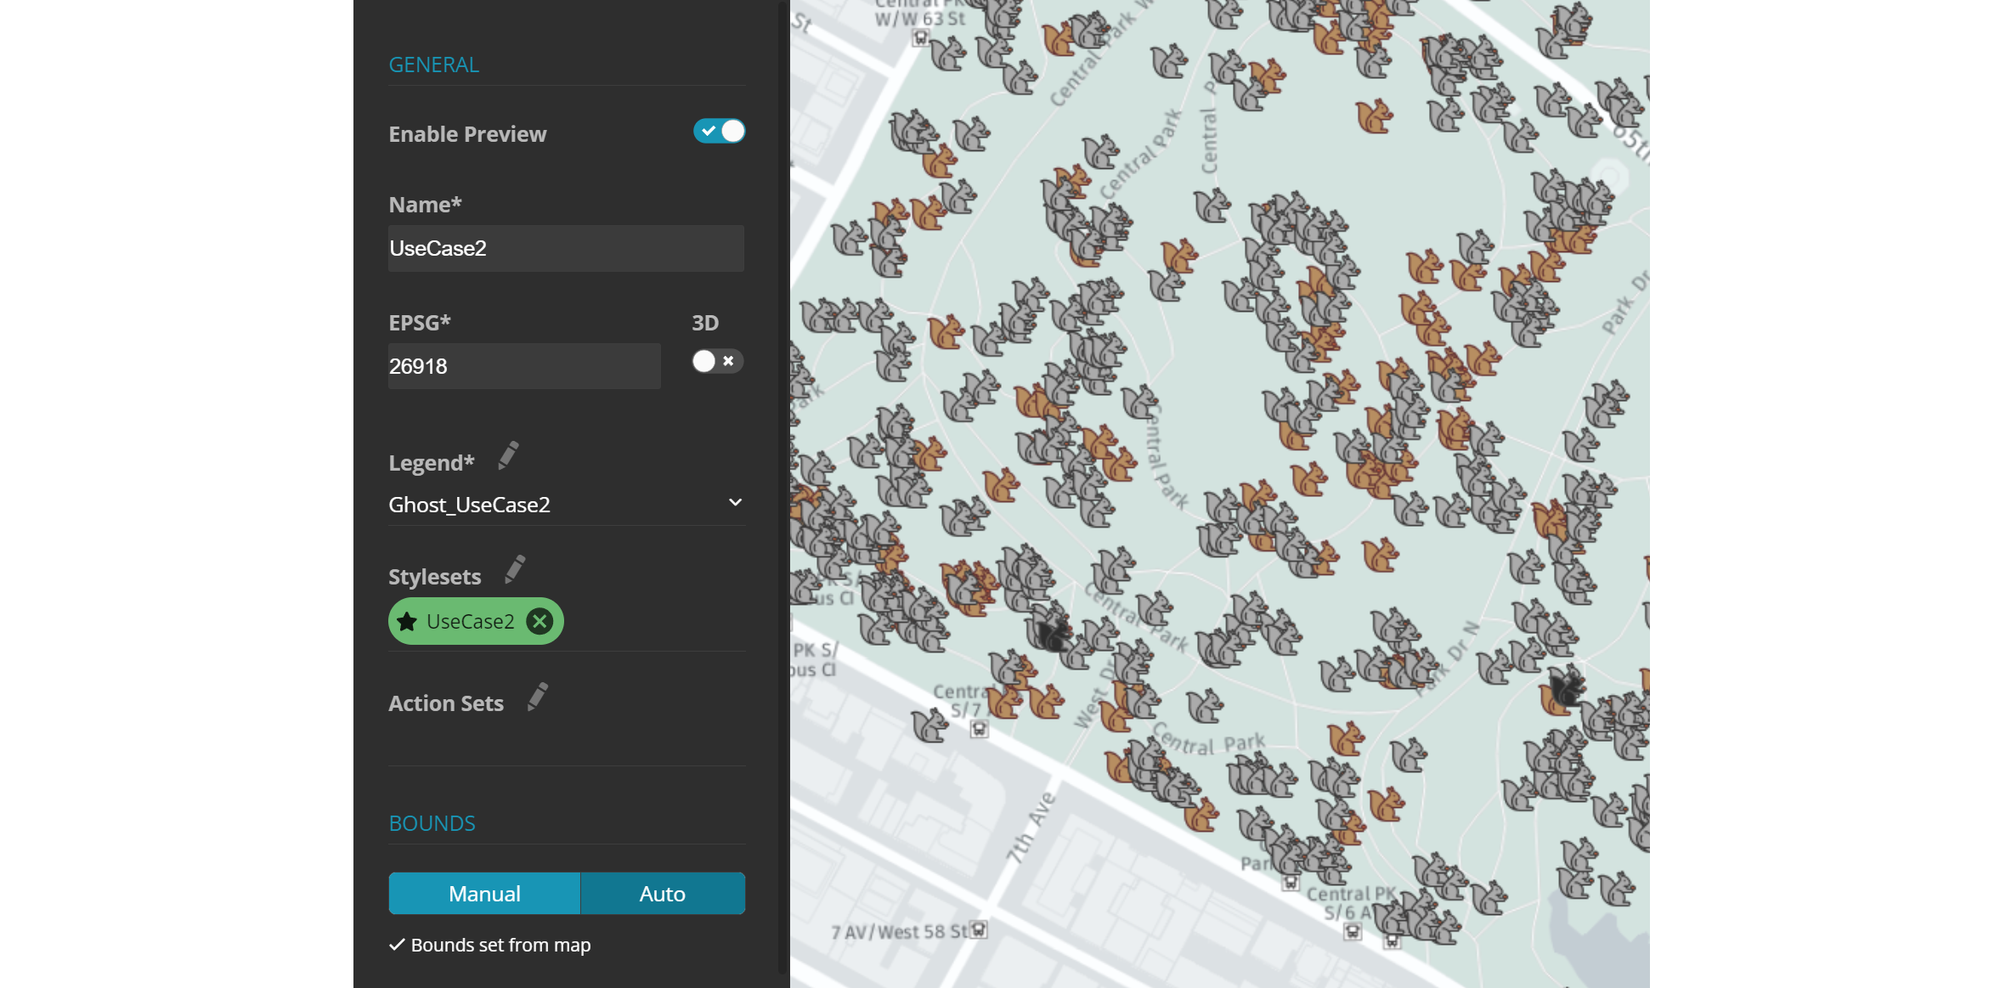
To create a Dashboard in the next step, you will need to first set up a map view that includes your legend, style set, and setting bounds for the map extent. Assign a name, select EPSG code 26918, and use the previously created UseCase2 legend and style set.
Some general information about Map Views can be found in the following post.

5. Dashboard
Now it's time to create the Dashboard which is done in the Browser section of the menu. Assign a name to it and open the Dashboard editor. Then select the appropriate Map View and enable the Squirrel Census layer to be analyzable.

We will now copy the Dashboard shown below. The red labelling should just demonstrate the names of the widgets used.
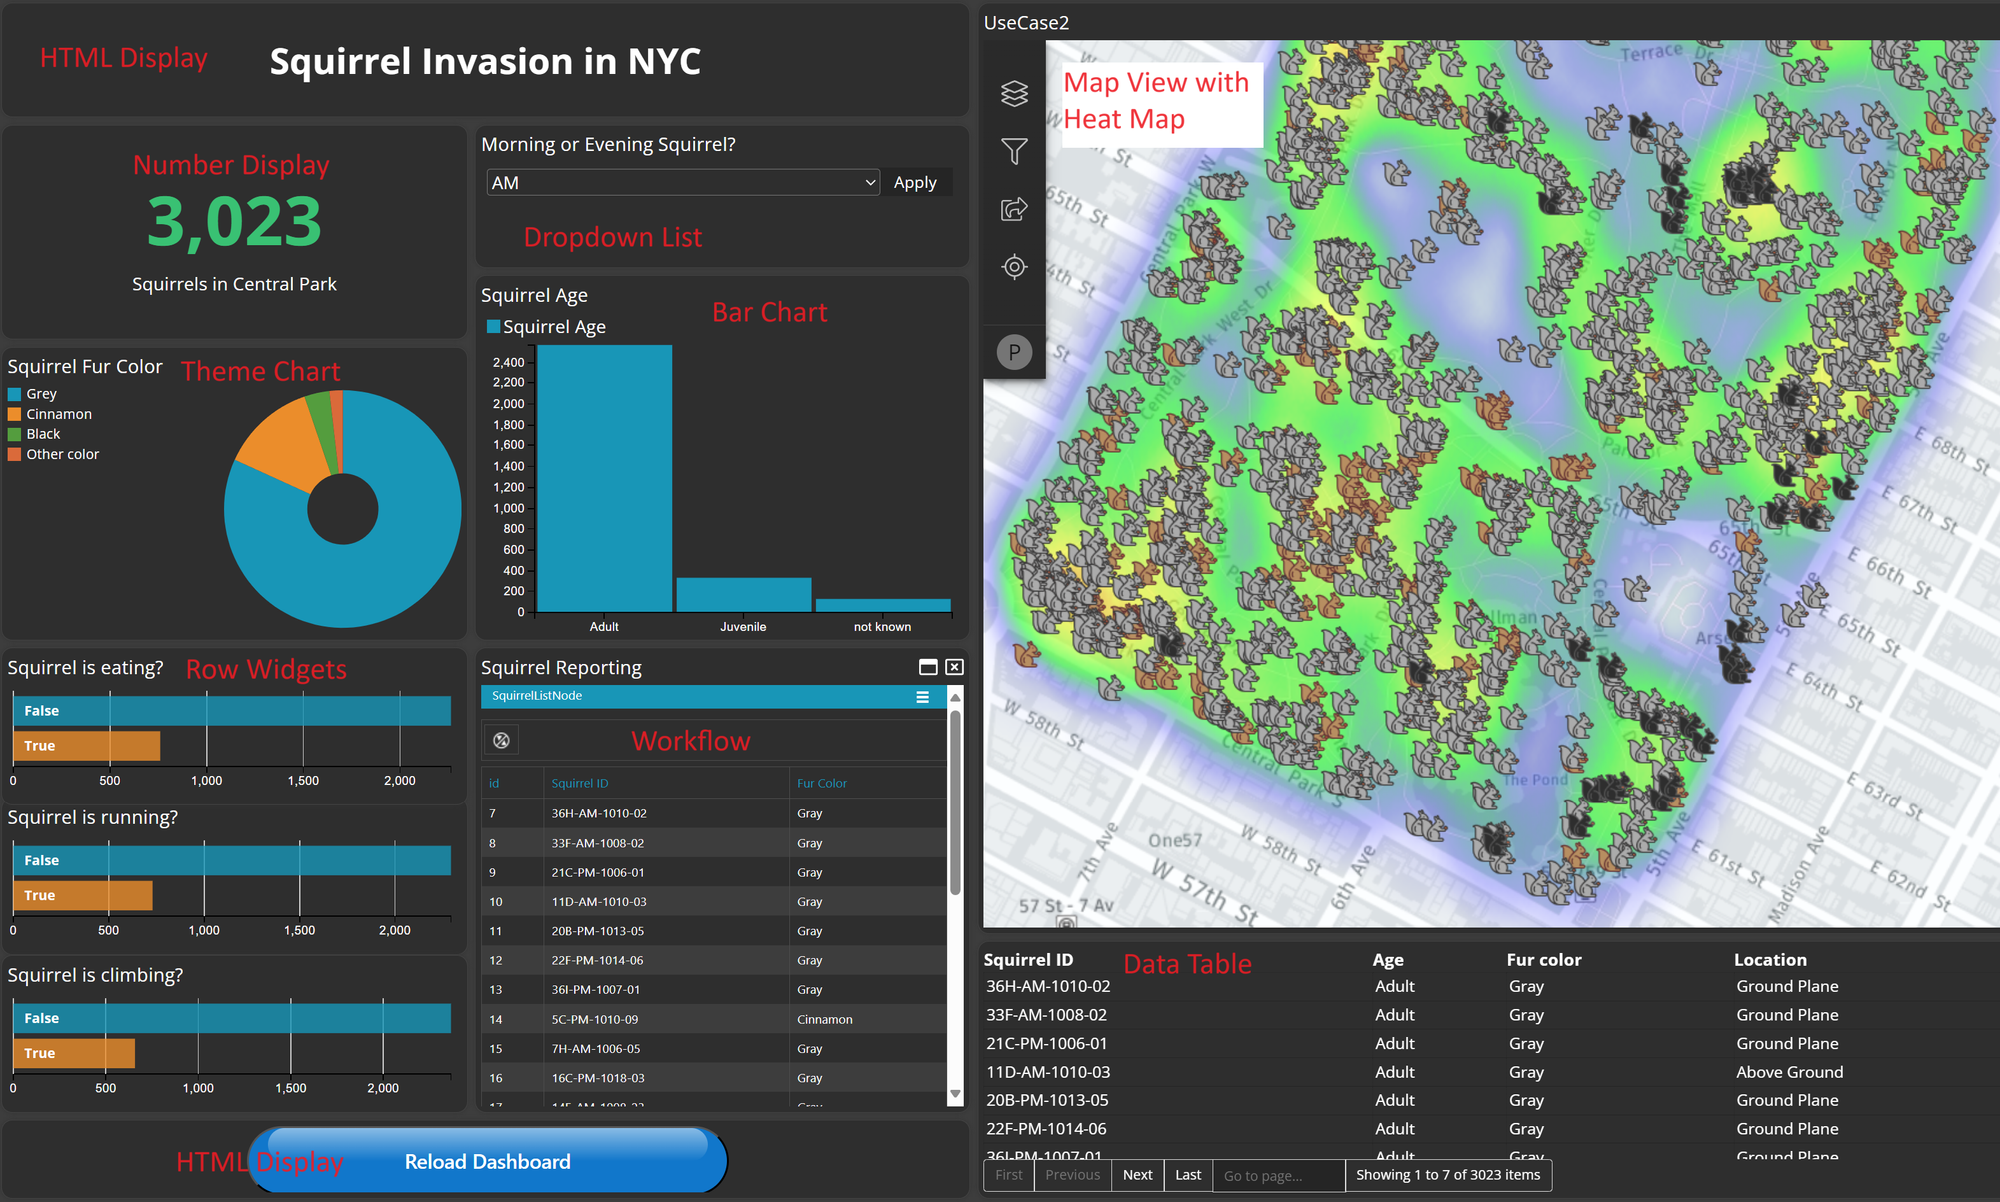
Let's start to create some widgets!
Theme Widget
From the widget menu, add a new Graph Widget of the Theme type. Name this widget Squirrel Fur Color and select the appropriate data set for the field name. Choose Custom for classification, which will make a button labeled Define appear.

Clicking on Define will open up a new window, where you can manually define ranges of values. Add 4 lines and then copy the text from below.

Click on OK and Apply to create the widget.
HTML Display
The HTML display served two different purposes on the dashboard: it was used for the dashboard title and the Reload button. Create a new HTML widget and move to the Editor section. Copy and paste the html codes from below and click on apply.
Number Display
Create a new Number Display Widget. In the General section, set Squirrel_Census as the Dataset and id as the Field name. Move to the Editor section, where some default code is provided. Modify the text from "count" to "Squirrels in Central Park."
Dropdown List
These settings are really straight forward. Simply choose the right dataset again and the field name and apply the changes.

Workflow Widget
To enable the previously created workflow within your Dashboard, you have to create a Workflow widget.

Choose the dataset on which our workflow is based. Select UseCase2 as our workflow and set the startup form to SquirrelListNode. Additionally, link the map view to the workflow and enable start on load so that the squirrel list loads immediately when opening the dashboard.
Row Widget
The three row widgets in our Dashboard are built with basic settings. Simply select the appropriate attribute fields: eating, running, and climbing.

Bar Widget
Again, just apply the settings suggested in the image below. Make sure to choose the appropriate field name and select Display Legend and click on apply.

Data Table
Add a data table widget to show the content of the squirrel census layer. Just adopt the settings from the image below and move to the Fields section of the settings window.

Within the fields section drop and drag the following attributes to the right panel and label them:
| Column name | Label |
|---|---|
| unique_squirrel_id | Squirrel ID |
| primary_fur_color | Fur color |
| age | Age |
| location | Location |
| date | Date |
Last but not least, in the style section, change the header size to 15px and the font size to 14px.
Heat Map
To create the heat map layer showing the distribution of squirrel sin central park, simply open the Luciad RIA widget that is automatically generated with your Dashboard.
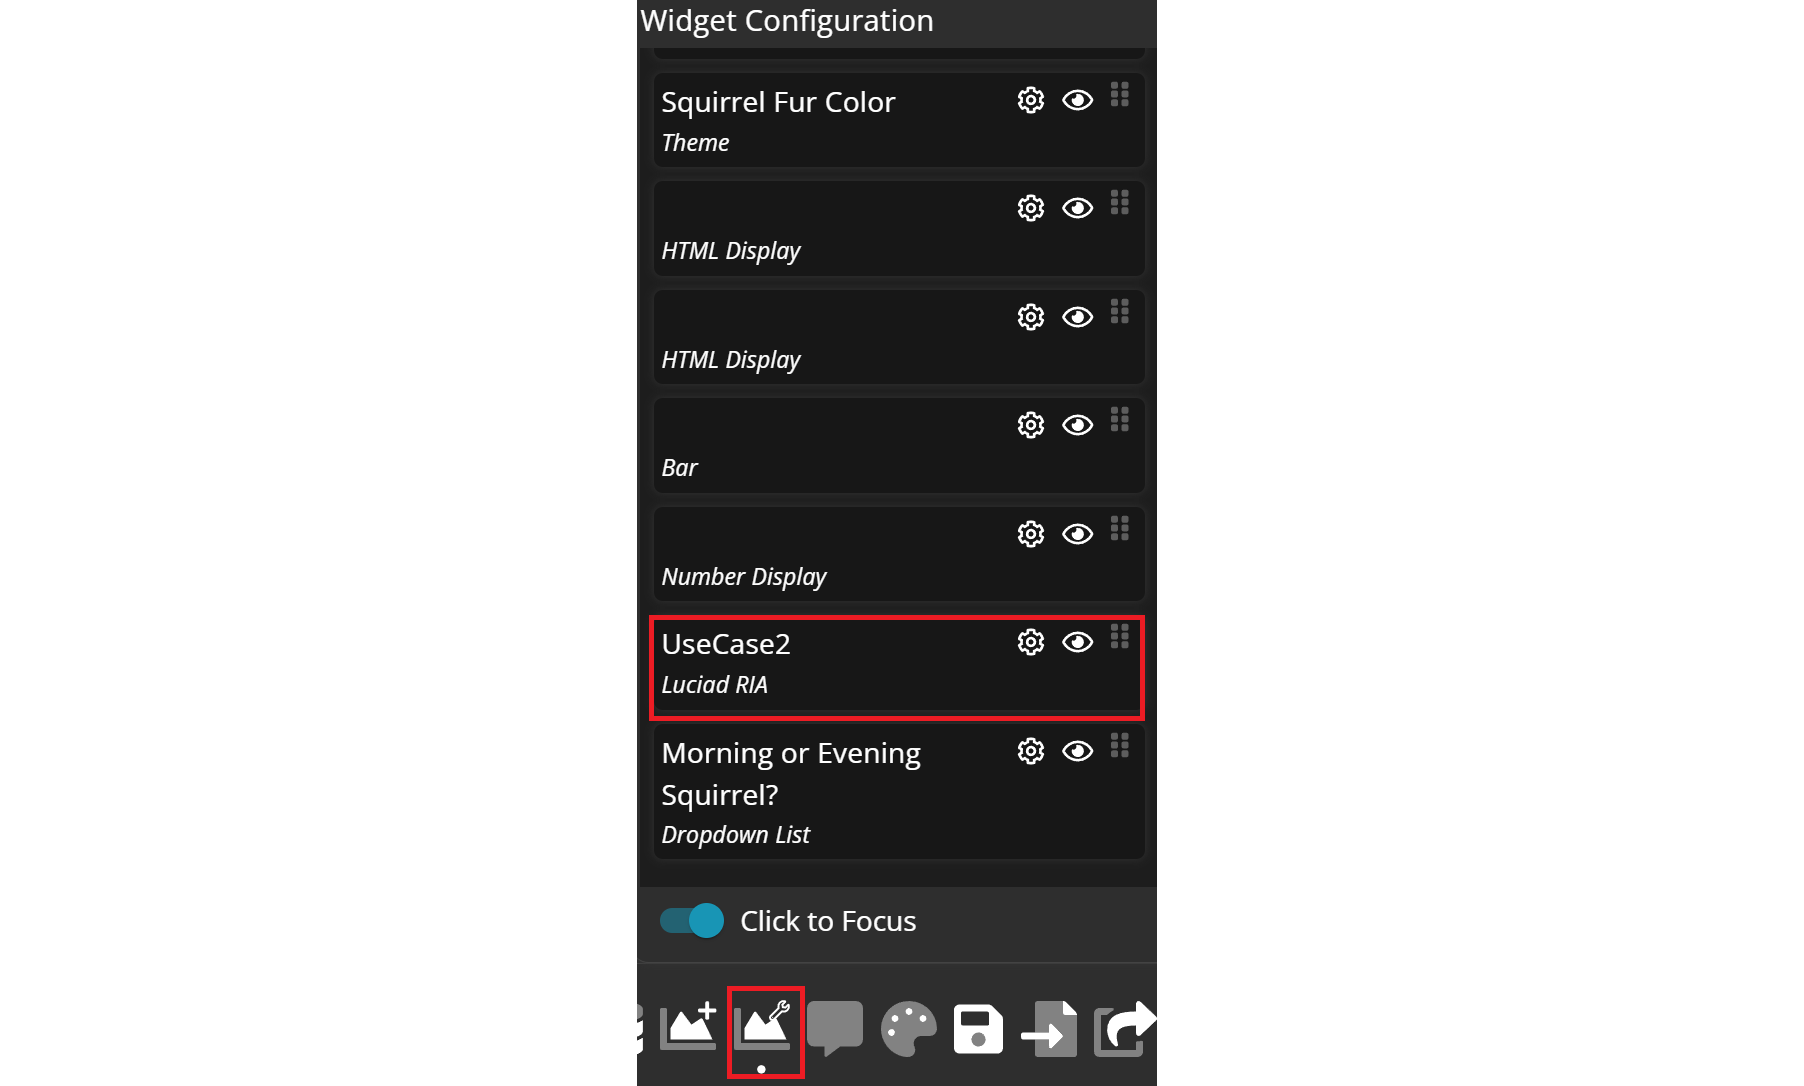
Navigate to the Features section and select the Heatmap button to create a new heatmap. Then, click on the settings icon next to the newly generated heatmap.

Choose the Squirrel Census dataset and set the distance to 100m. Click apply to implement the new settings.
Arranging the Widgets
Now that all the widgets are created, we need to arrange them in an orderly and appealing manner for display.
First, we don't want the map to occupy the entire background. To adjust this, open the RIA widget again. Then, click on the monitor icon and select Float instead of "Background".

Then simply drag the widget windows into the correct positions and resize them if needed. Make sure that you keep the distance between the windows as equal as possible so that the dashboard looks aesthetically pleasing.
