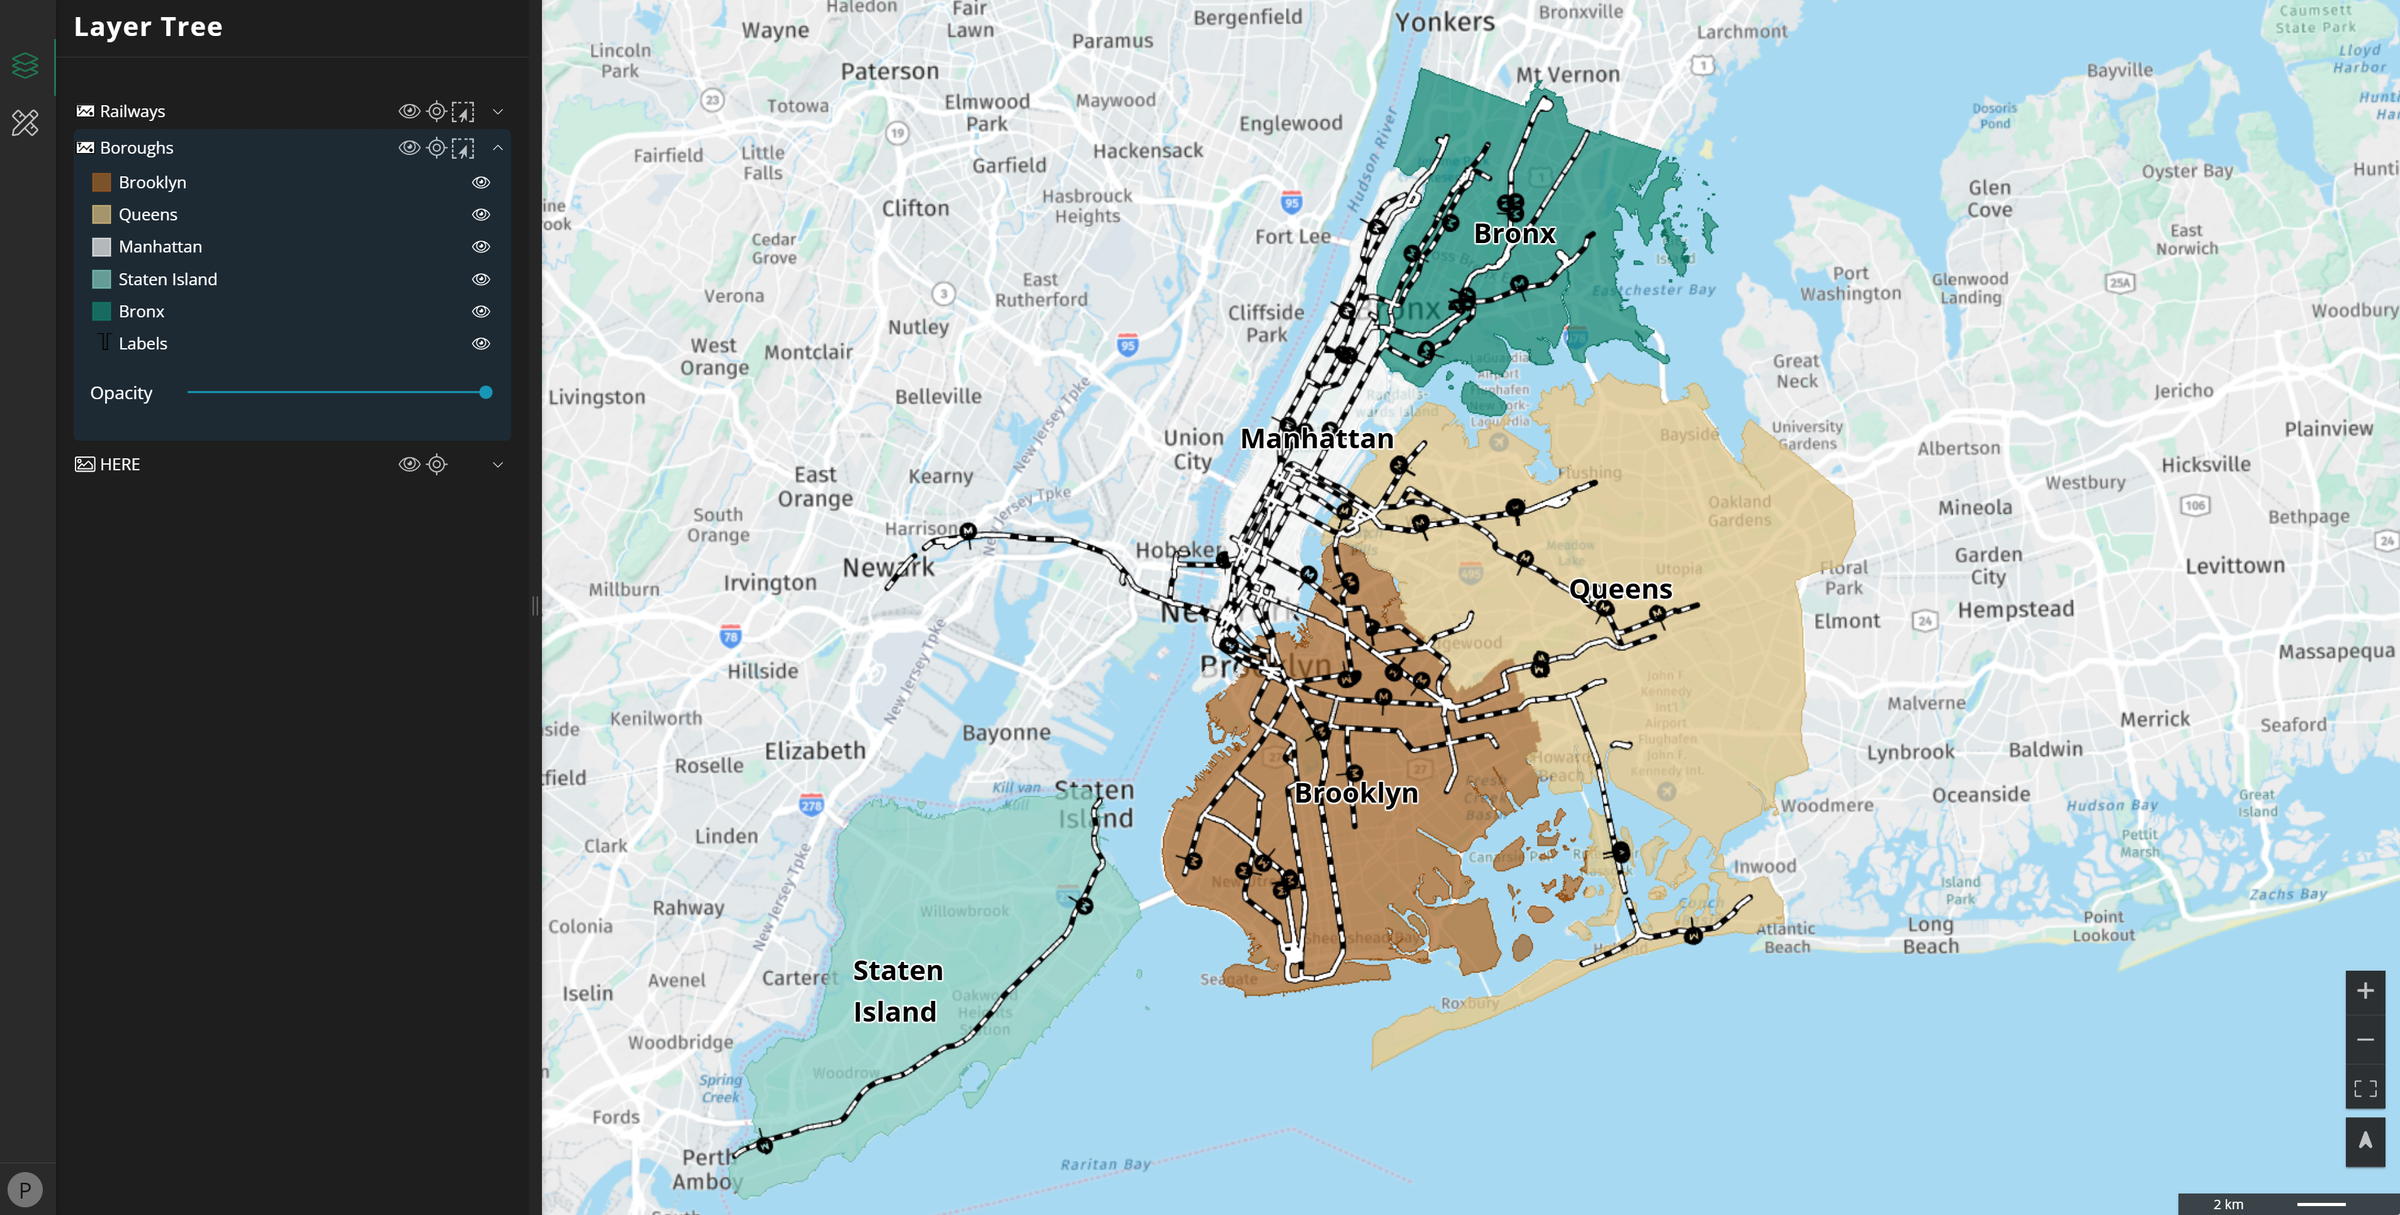
This tutorial will showcase the steps to create a look-alike map with nice labels, a styleset and the inclusion of icons in M.App Enterprise.
1. Data
To begin, incorporate vector data from the provided New York datasets into M.App Enterprise. Access your Studio account, navigate to Content in the left menu, and opt for Vector Data. Click on New, choose an existing connection or establish a new one, then proceed to add the needed datasets.
In this example we choose two layers: Boroughs and Railways
For further guidance on accessing the New York datasets or importing vector data, consult the tutorials provided below.

In addition to the vector data in our example, we have included HERE Map V3. To integrate this into our map, navigate to Geoservices in the content menu and create a new HERE Map Service. You'll need an API key from the HERE developer portal for this. Then choose a name and pick Resources: base, Styles: lite.day, Language: en;

2. Legend
Now create a legend by navigating to the content menu again and by clicking on Legend. Make sure to include both the Boroughs and Railways layer as well as the HERE Map in your legend.

3. Styleset
To create a new styleset, navigate to the content menu and select Stylesets.


Boroughs Layer
Once in the Style Editor, open the wizard by clicking on Generate and Categorize. From there, select the Boroughs layer and Boroname as the input parameters. Accept the suggested settings and click on Generate. You will now see the boroughs of New York displayed in the map view.
Adjust the following two things:
- Set the
fill opacityto 70% for each borough. To do this, click on the respective borough in the rule navigator on the left. Then change the fill opacity from 100 to 70. - Add a rule to the rule navigator and then add a
text symbolizerby clicking on the plus icons.
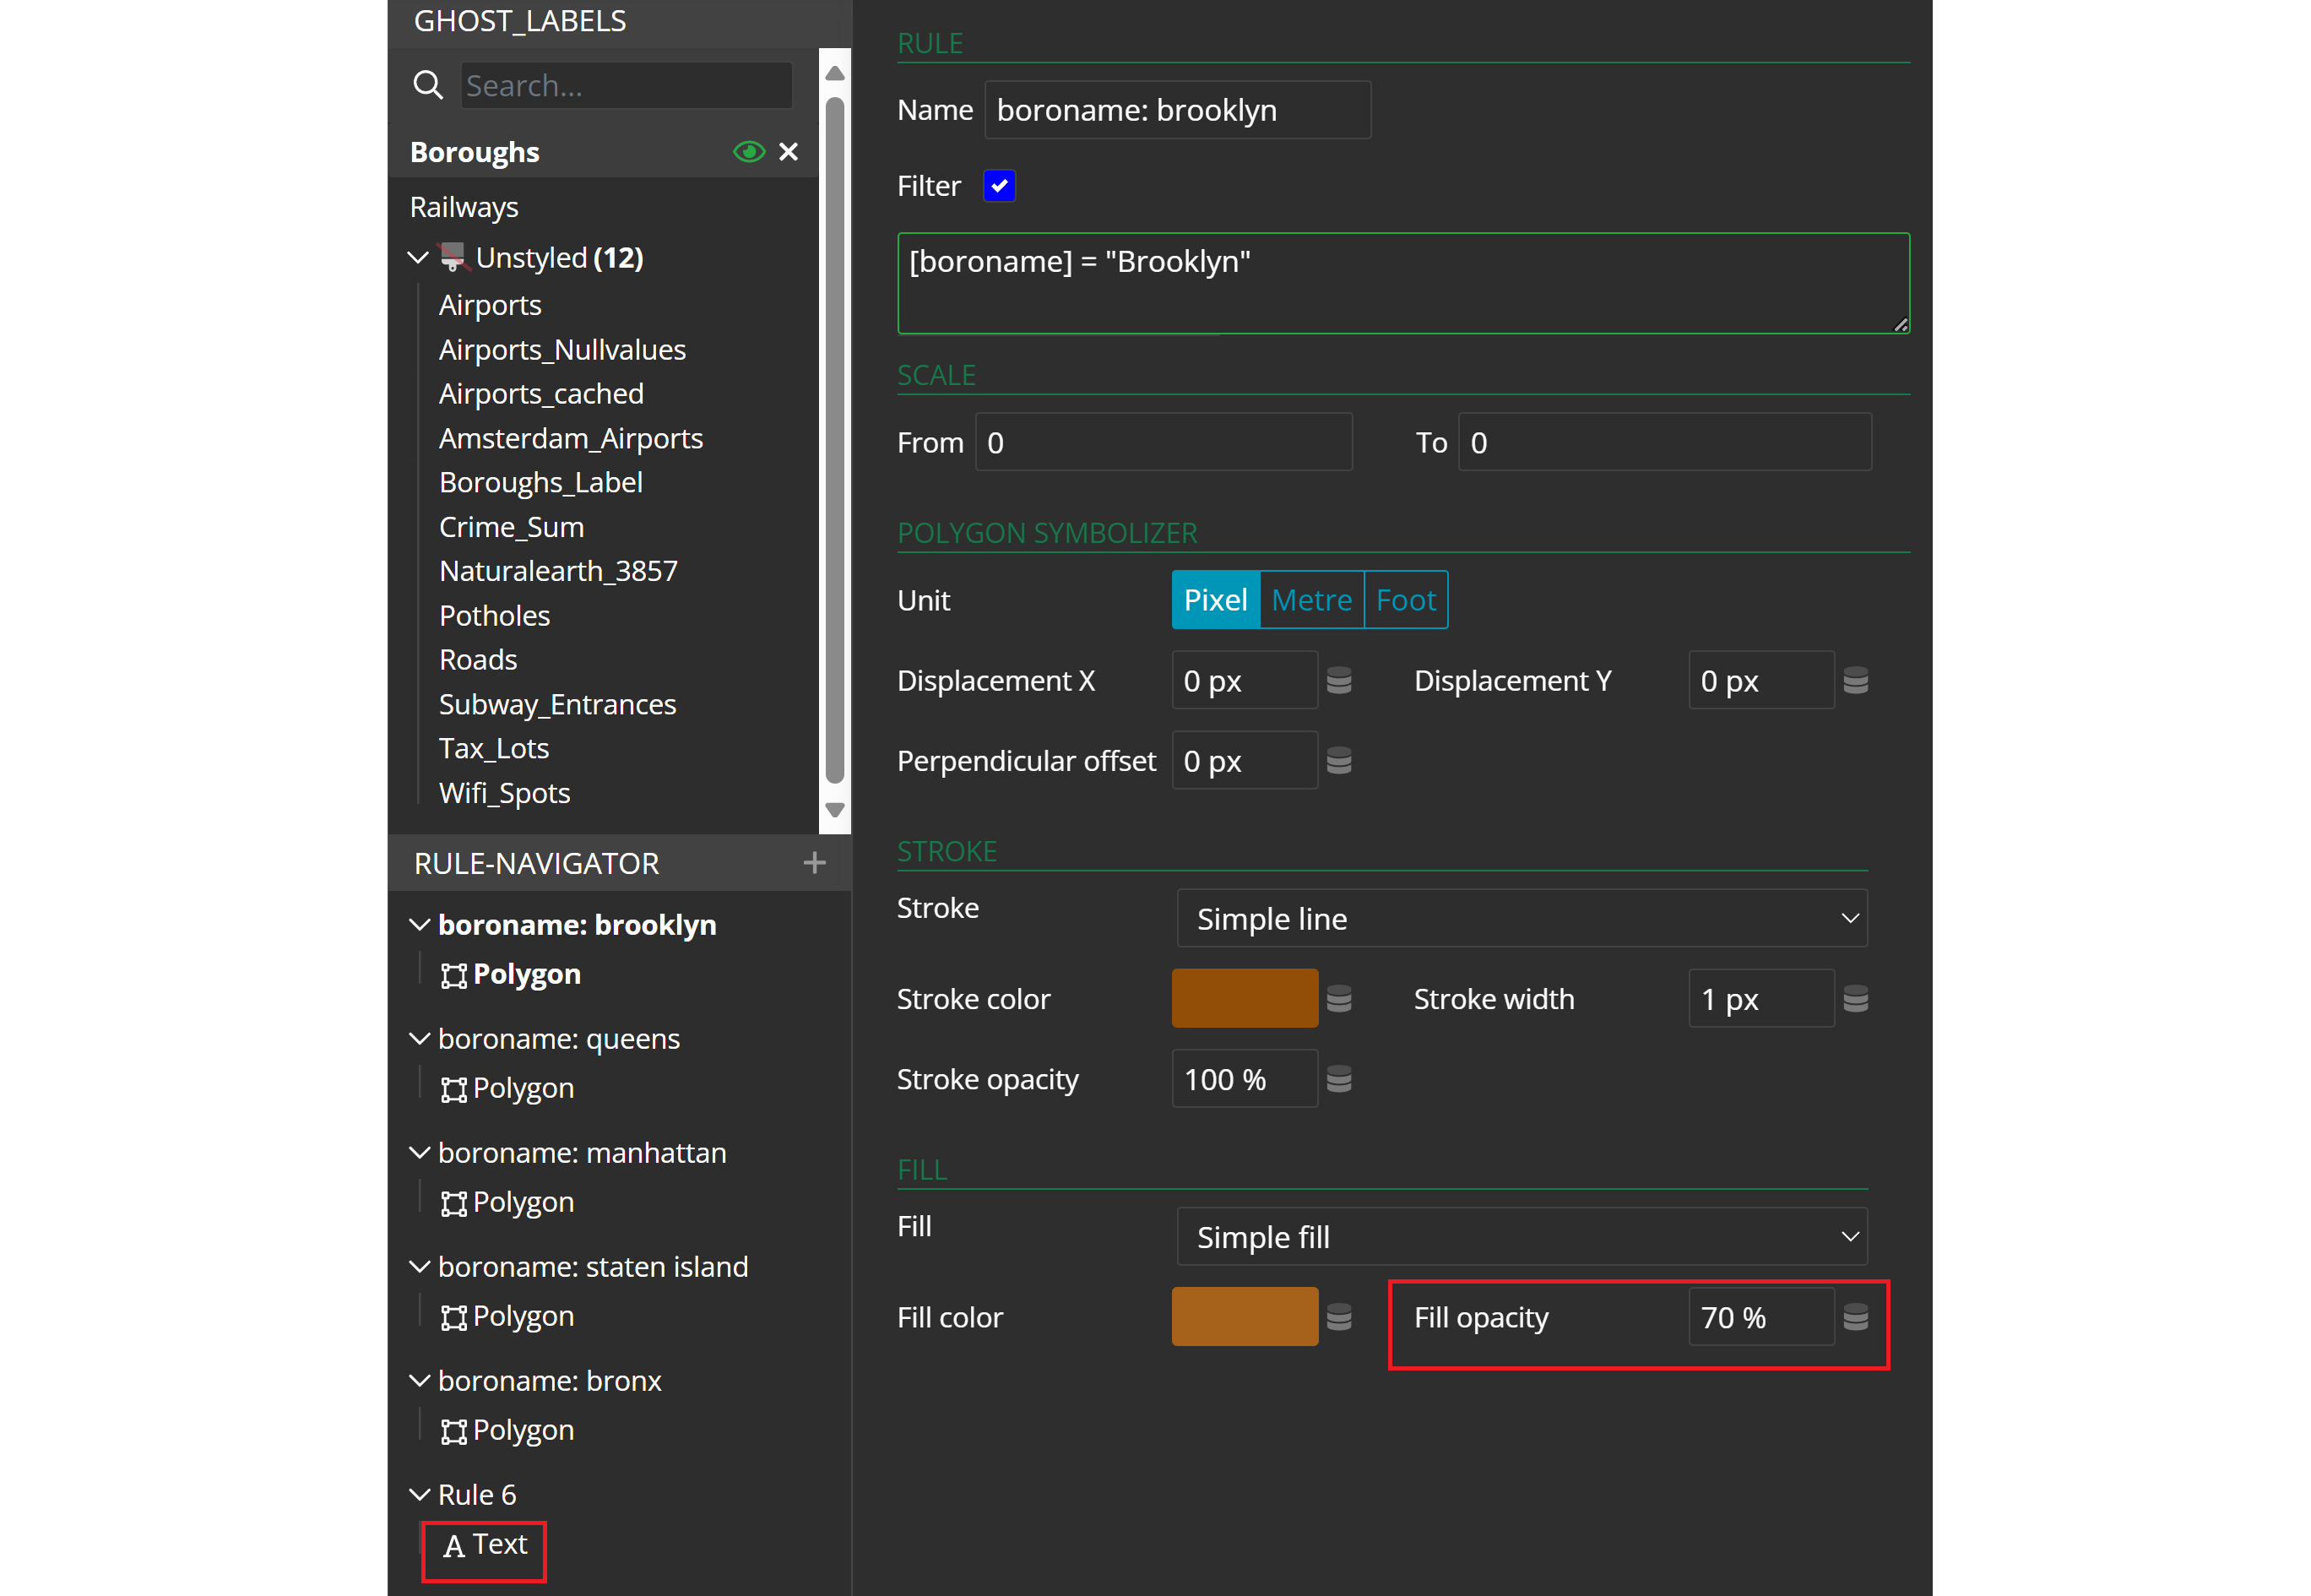
The text symbolizer will serve as labeling text. Click on it for more settings.
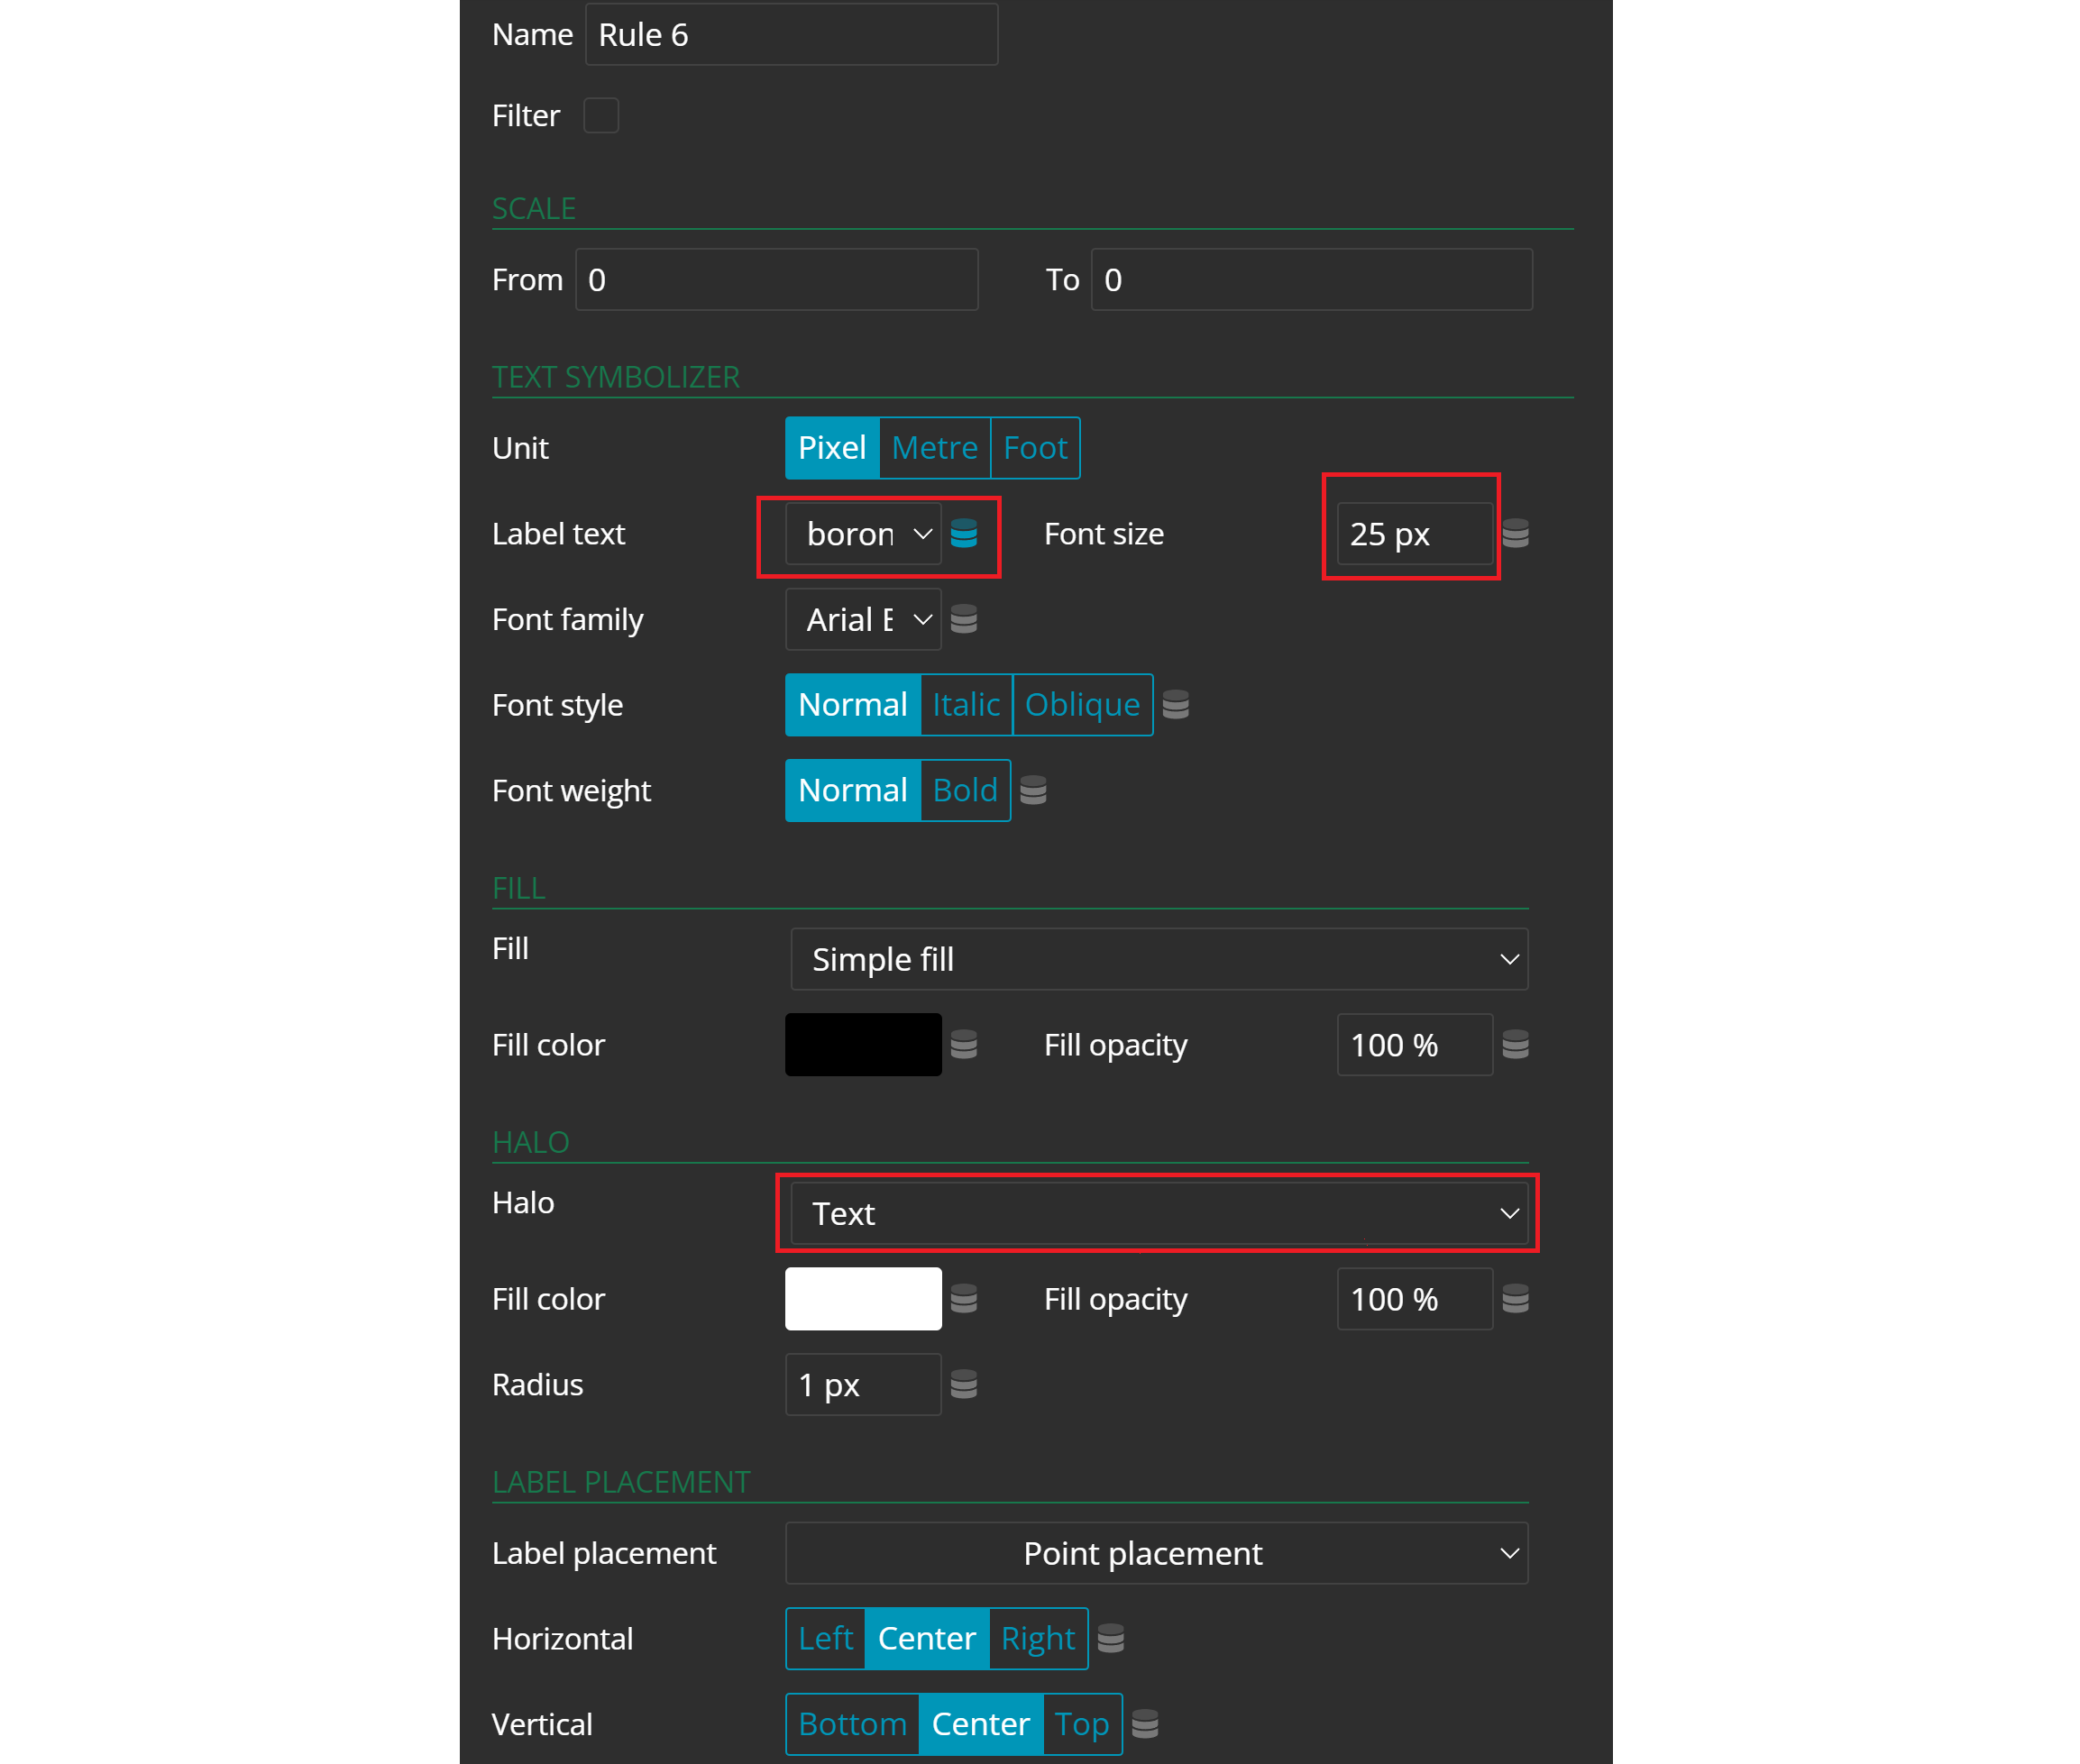
The label text will be sourced from one of the dataset's attributes. When you click on the database icon, a dropdown menu with all the options will appear. Select boroname and set the font size to 25px beside it. Additionally, select text in the halo section to apply a nice halo effect to the labeling text.
Railways Layer
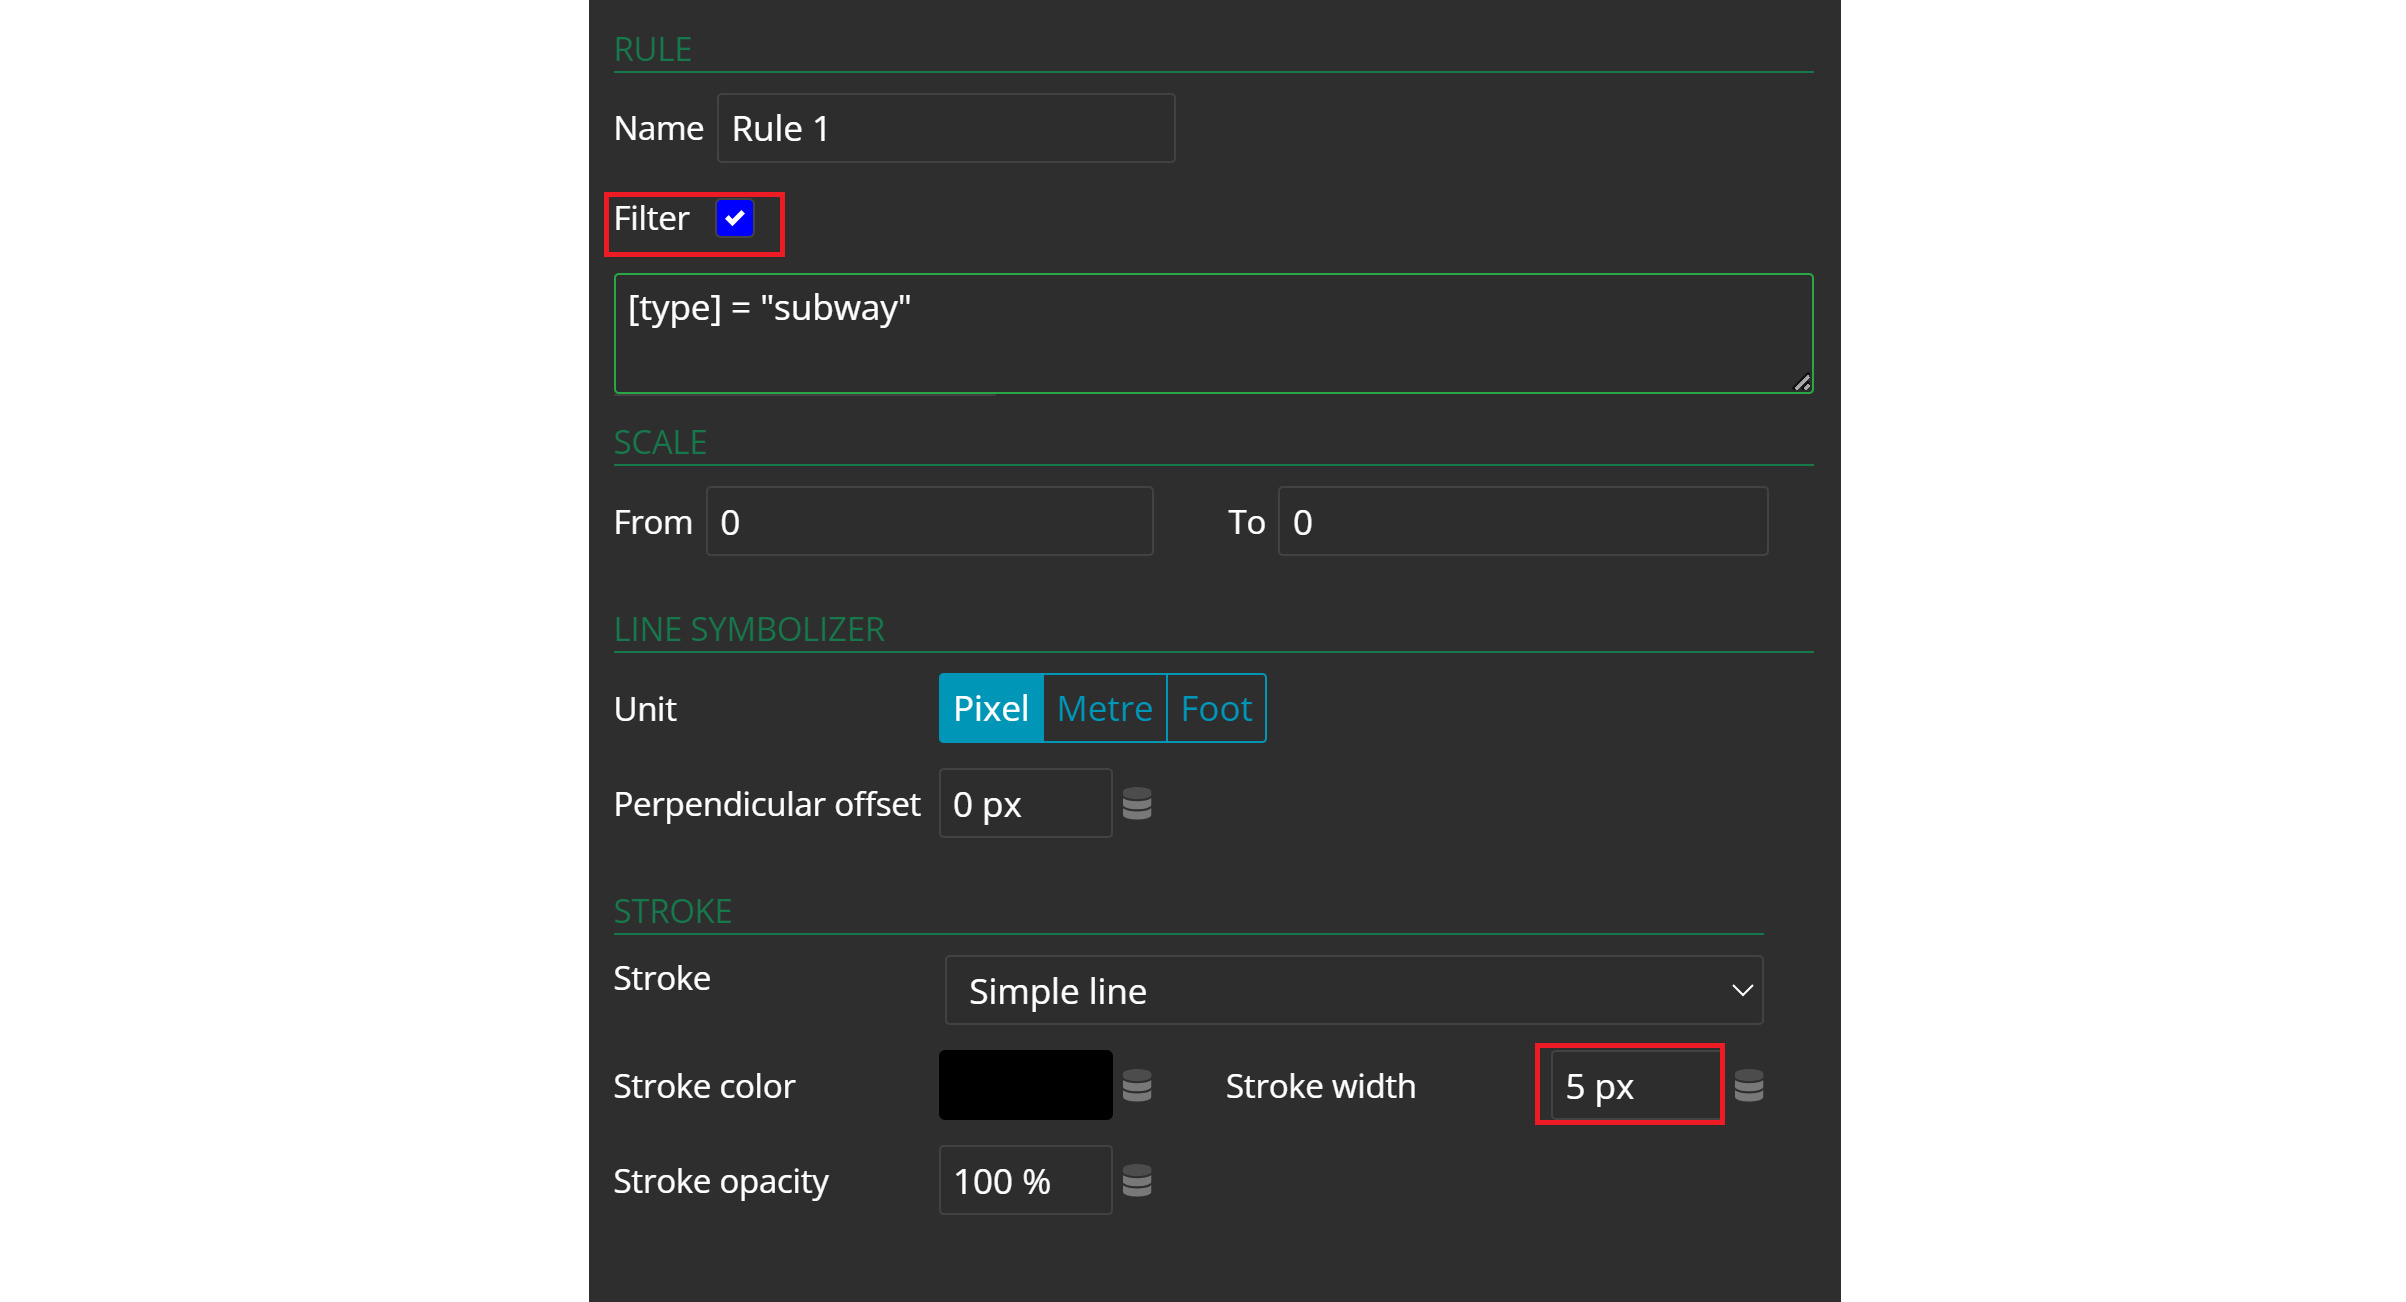
Now one layer is styled, choose railways from the unstyled layers' list on the left. Tick the checkbox for Filter and type [type] = "subway" in the text field, so only subway rails are included in the visualistation. Increase the stroke width to 5px.
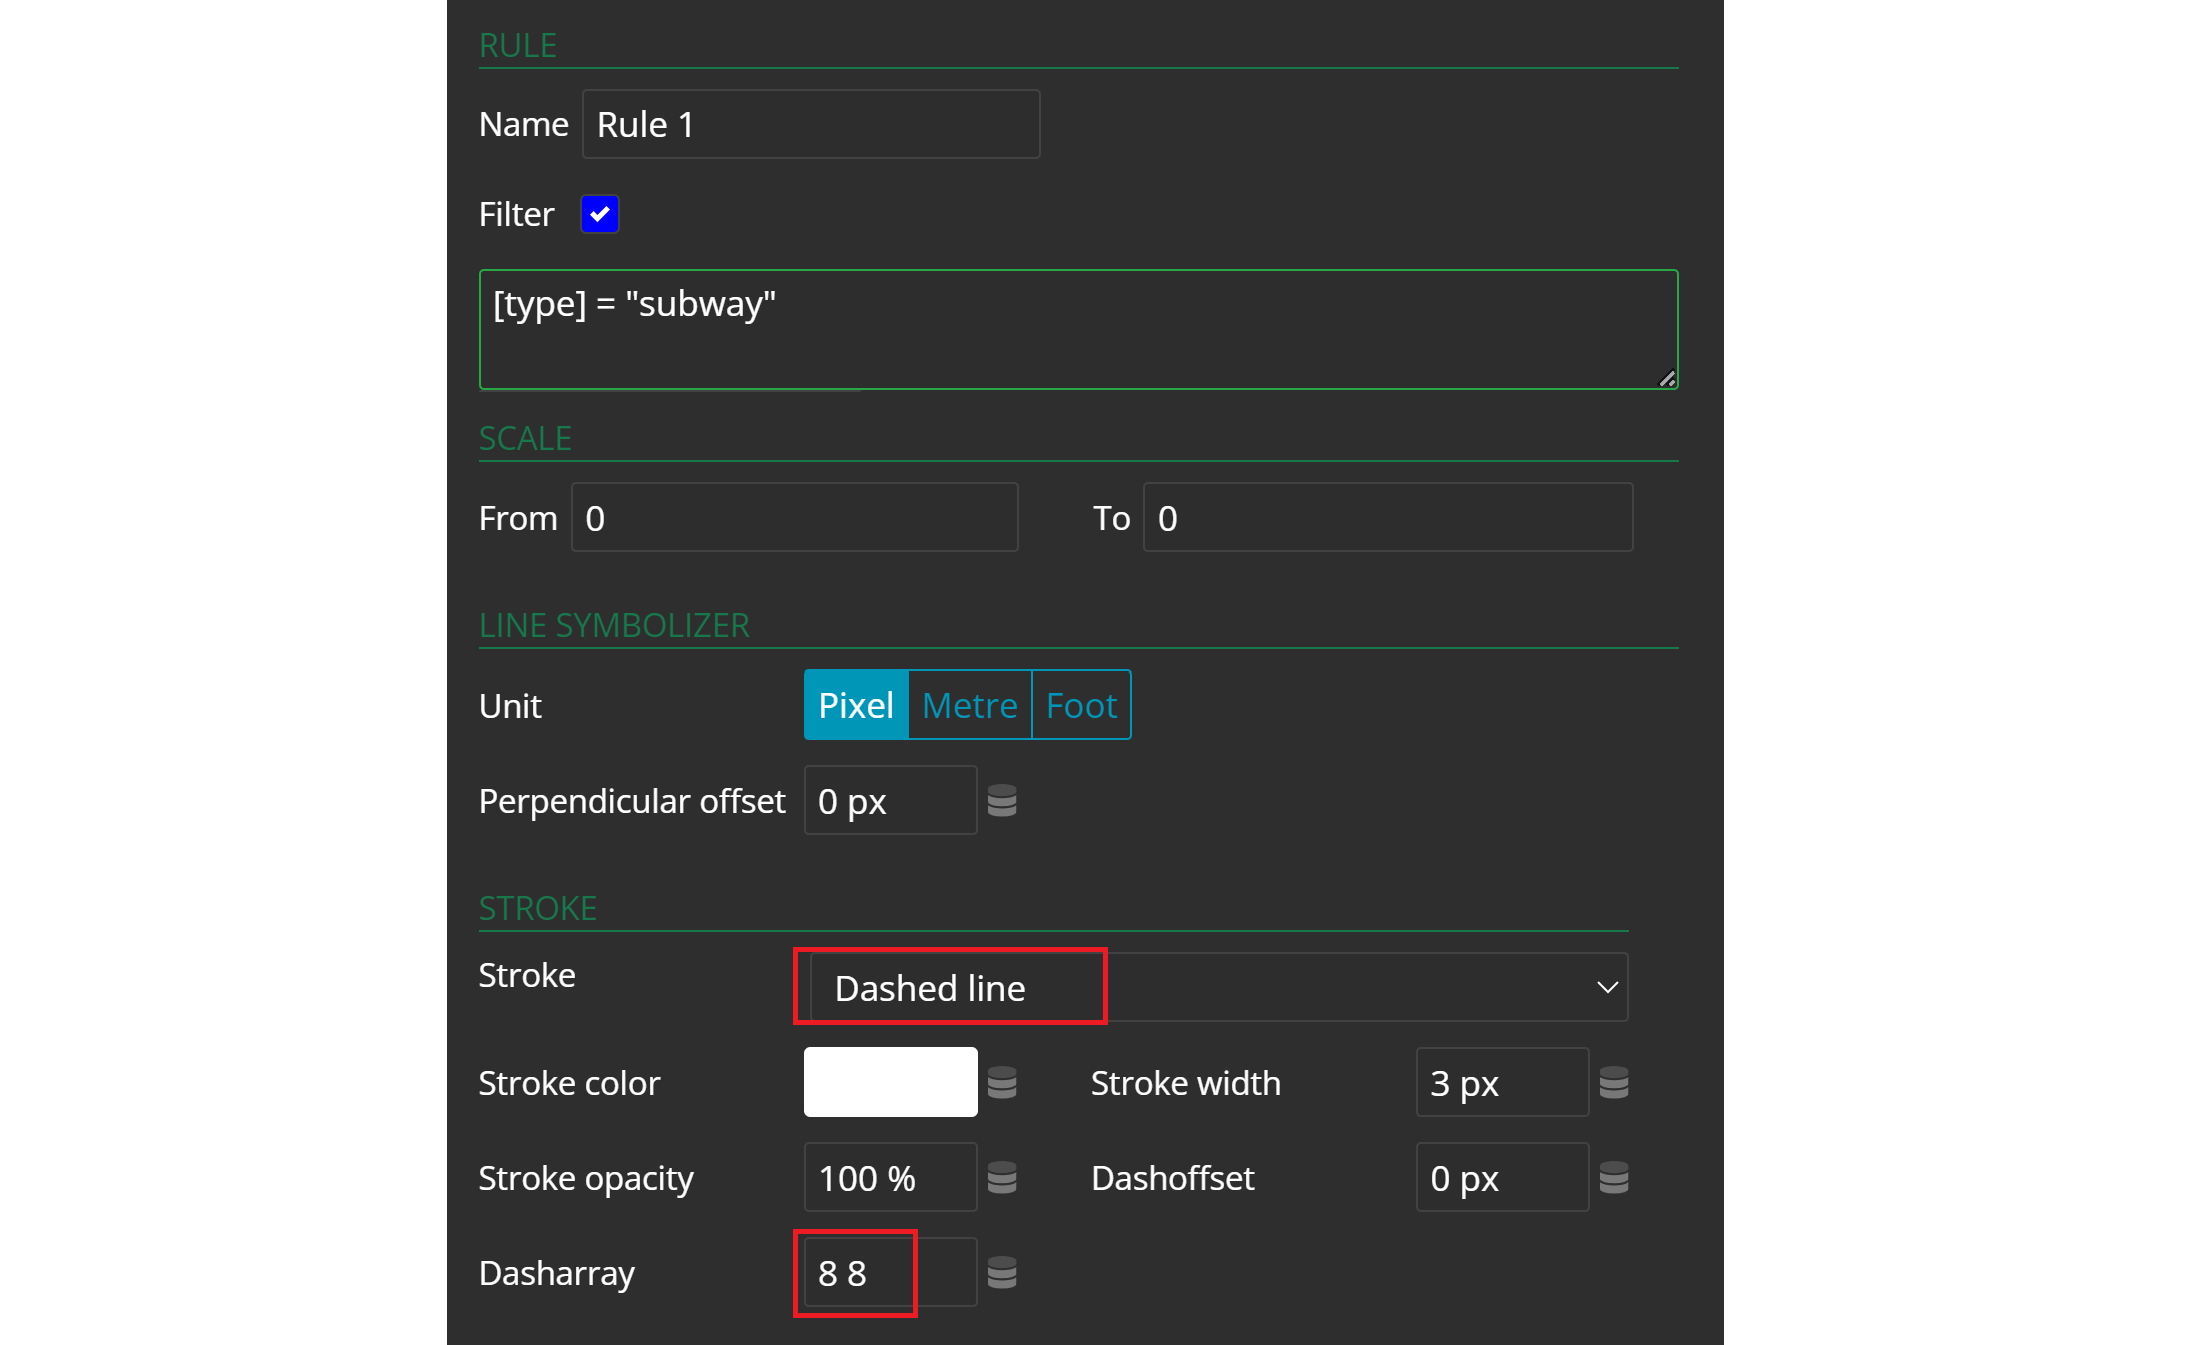
Add a symbolizer of type line in the rule navigator. Apply the same filter and select Dashed line in the stroke section. Choose white as the stroke color and enter 8 8 in the field Dasharray.
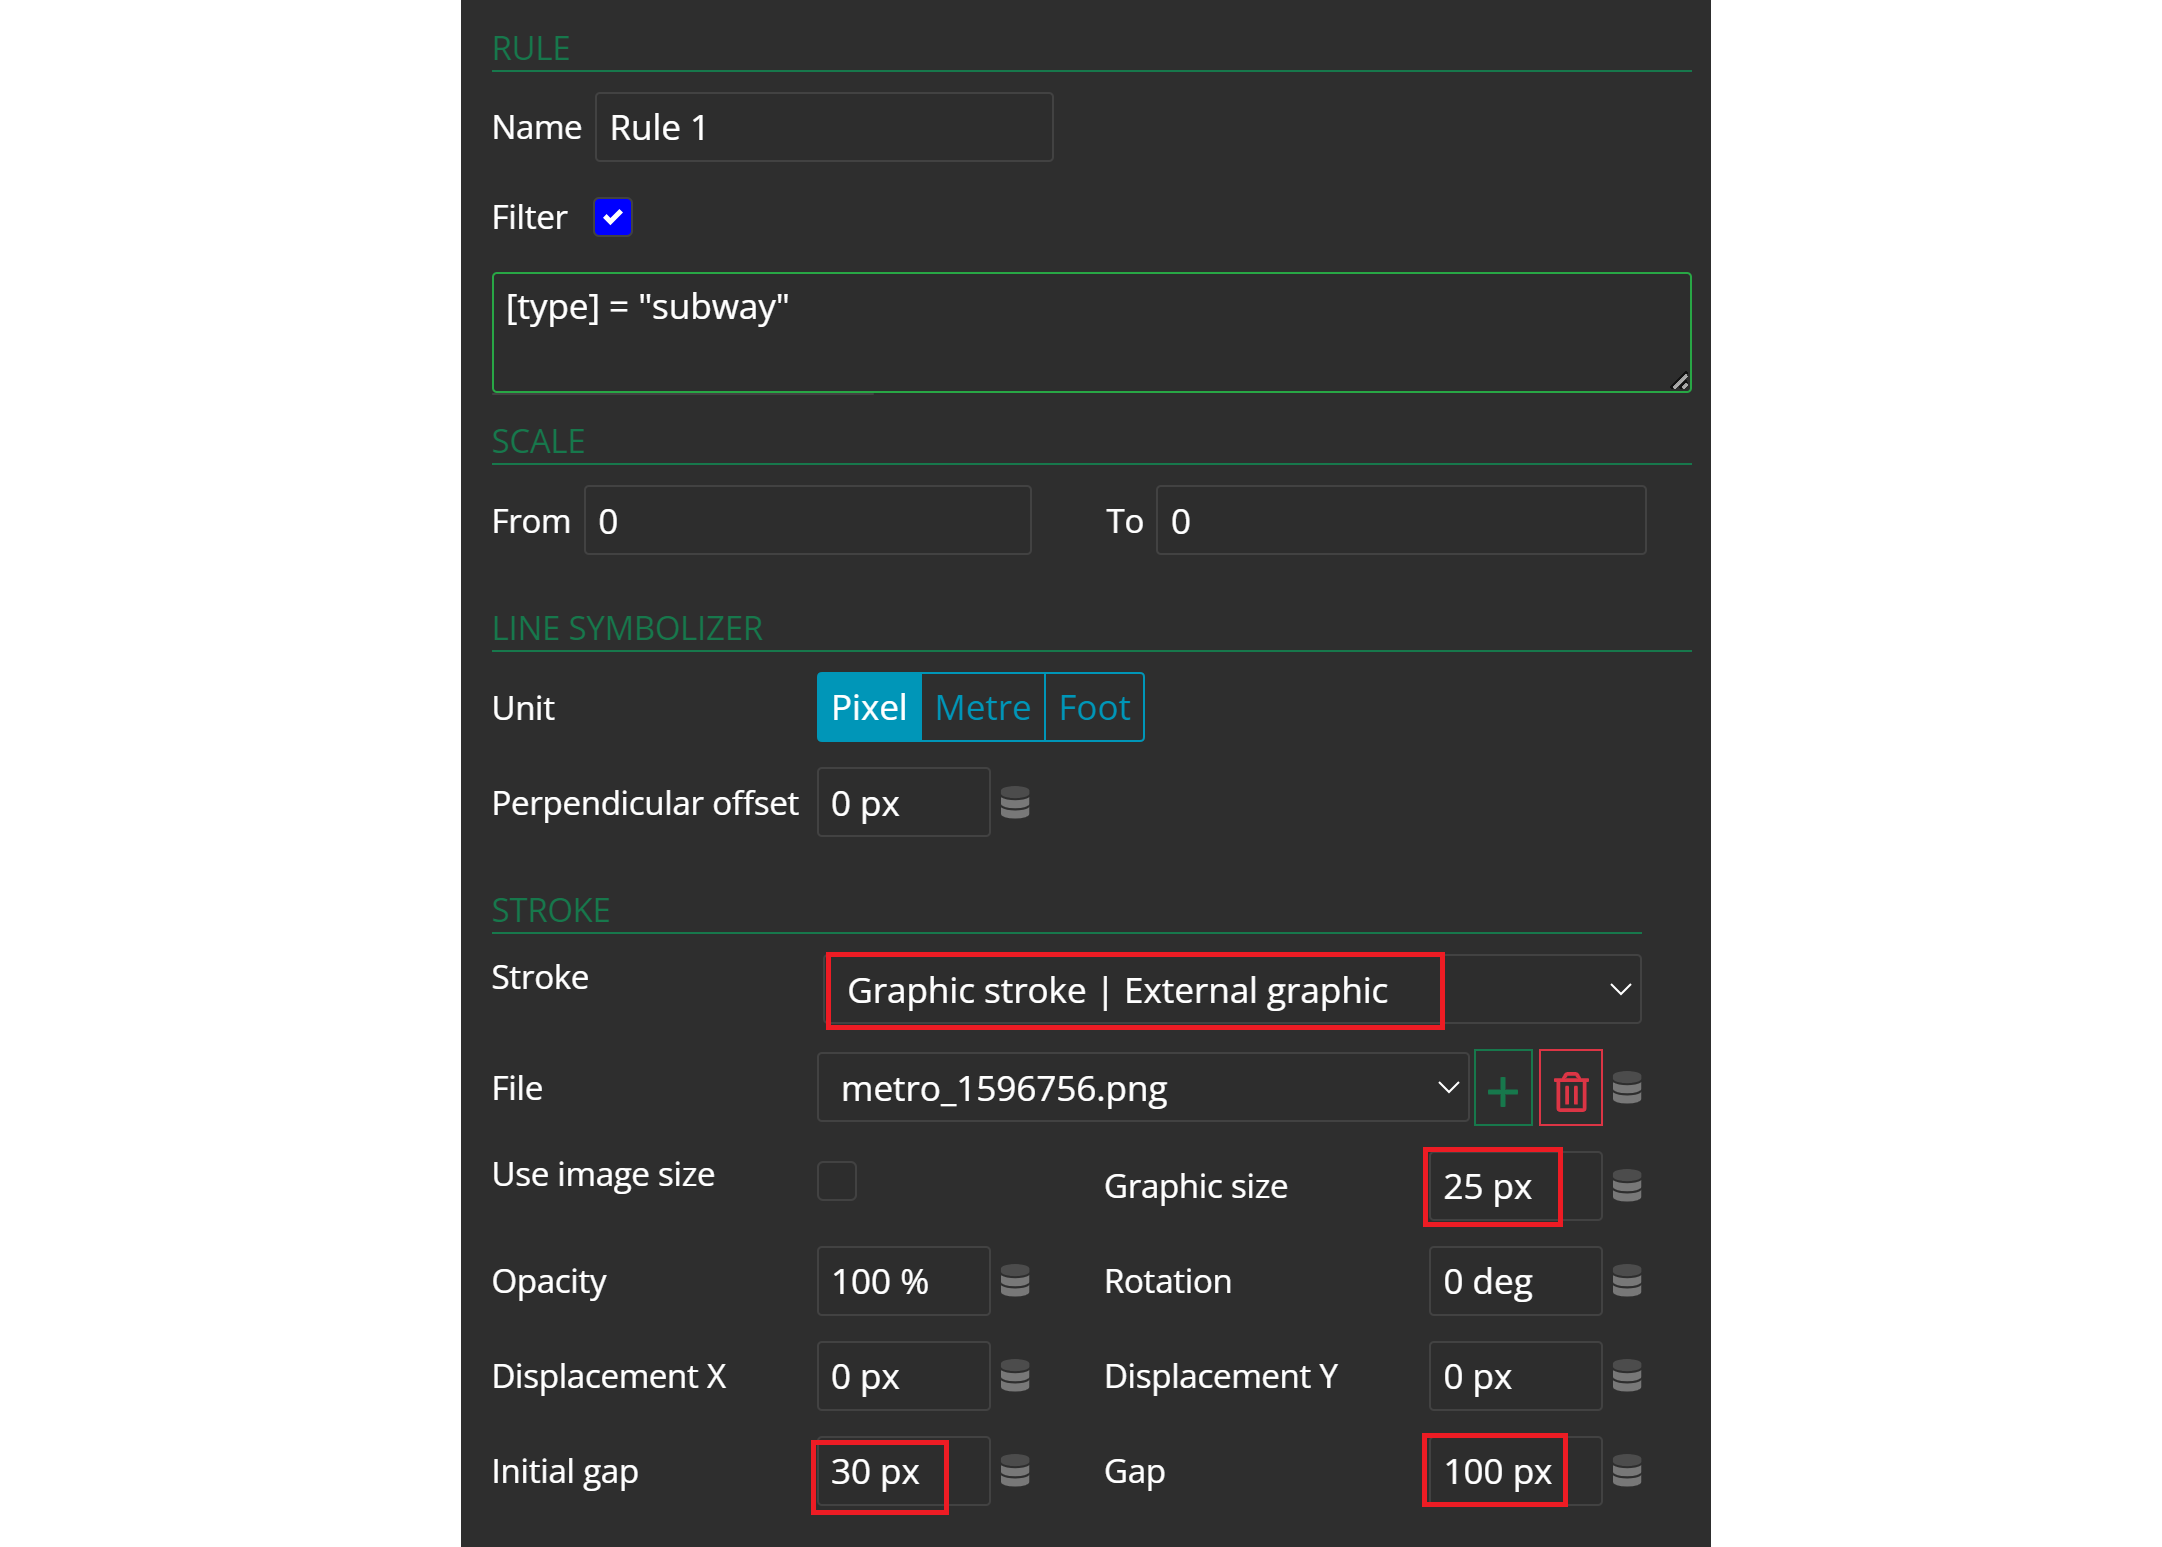
Finally, add a third line symbolizer in the rule navigator. Apply the same filter for subway and select Graphic stroke/External graphic in the stroke section. Add a metro icon saved as a PNG file on your drive by clicking the green plus symbol to access and upload it. Set the graphic size to 25px, define a gap of 100px, and set an initial gap of 30px.
Save all the changes and move on to the next step.
5. Map View
Navigate to Browser and MapView in the Studio menu on the left and create a new MapView.
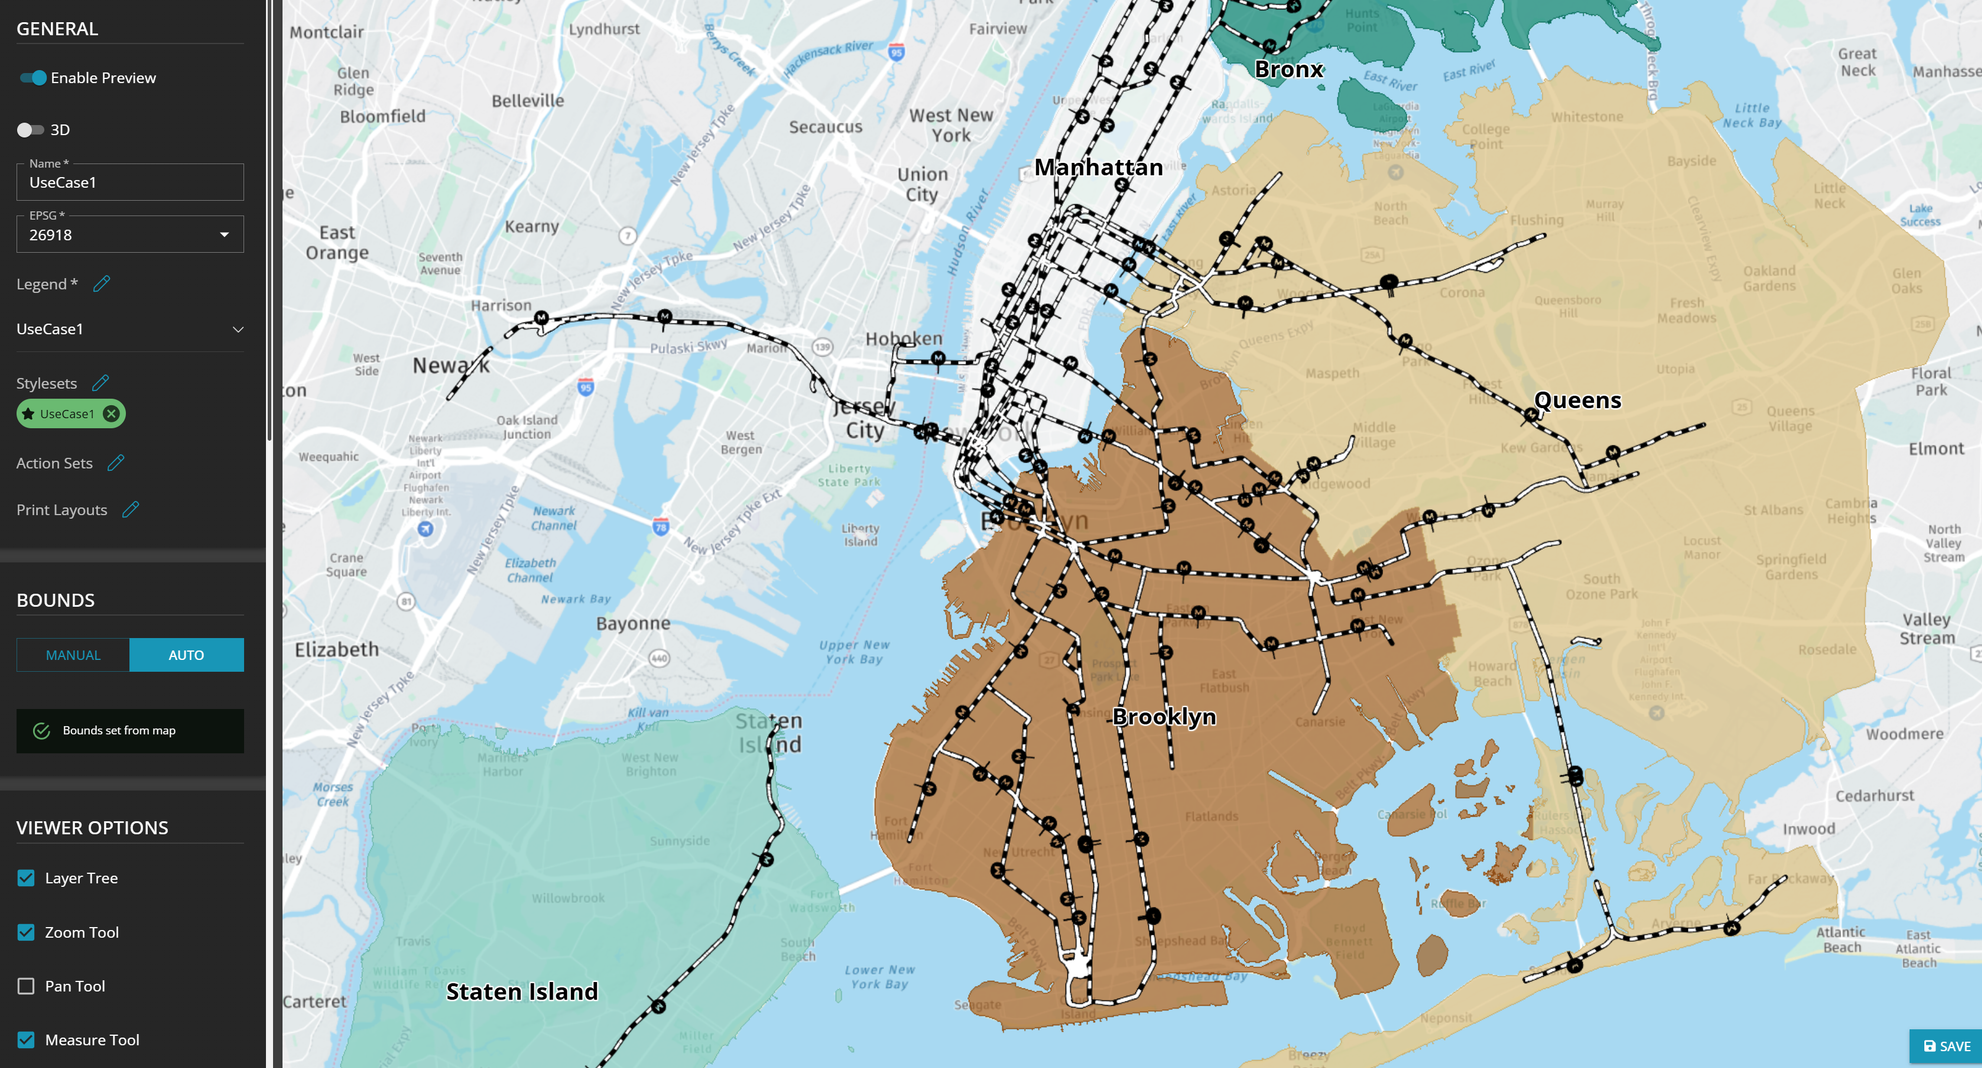
Name your Map View, enter EPSG 26918, use the correct Legend created earlier and select the appropriate Styleset. Enable the preview and zoom into New York City to set the Bounds automatically. Save it and move to the last step.
6. Browser App
Finally, create an app and assign it the correct Map View. Detailed information on creating a browser app can be found in the following tutorial.

