
This post will elaborate on all the options you have to create tooltips in a Dashboard and how to display them.
As of M.App Enterprise version 16.9 it is possible to show tooltips in a Dashboard application as well. There are several approaches available for integrating tooltips into a dashboard.
| Options | Advantage |
|---|---|
| Studio Tooltip | Lots of styling options, customized solutions |
| Dashboard Tooltip | Easy handling with drag and drop |
| Result | |
| Studio Tooltip + Dashboard Tooltip | Dashboard tooltip is shown |
Let's begin with the conventional approach to producing tooltips for any application.
1. Defining a tooltip in Studio
The steps to produce a tooltip for a vector layer in M.App Studio are well addressed in our tooltip posts.
 Marina Lanxinger
You will discover a more sophisticated-looking tooltip and a guide to reproduce it in the following post.
Markus Holler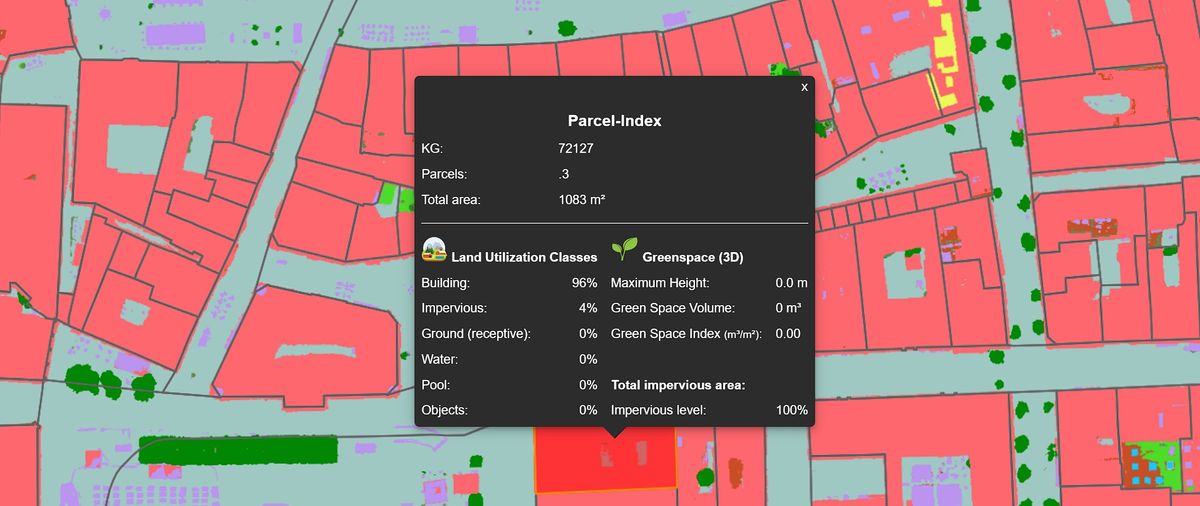
Dashboard settings
Once you have created a tooltip for your vector layer, you can open your dashboard editor to ensure that your tooltips will be displayed in the map view.
analyzer layer in the Luciad RIA settings, otherwise, your tooltip will not appear.Example
To view the tooltip in the app, you must first set the layer active within the legend.
The Studio-generated tooltip may look like the example below, disregarding the fact that there are various possible styling options.
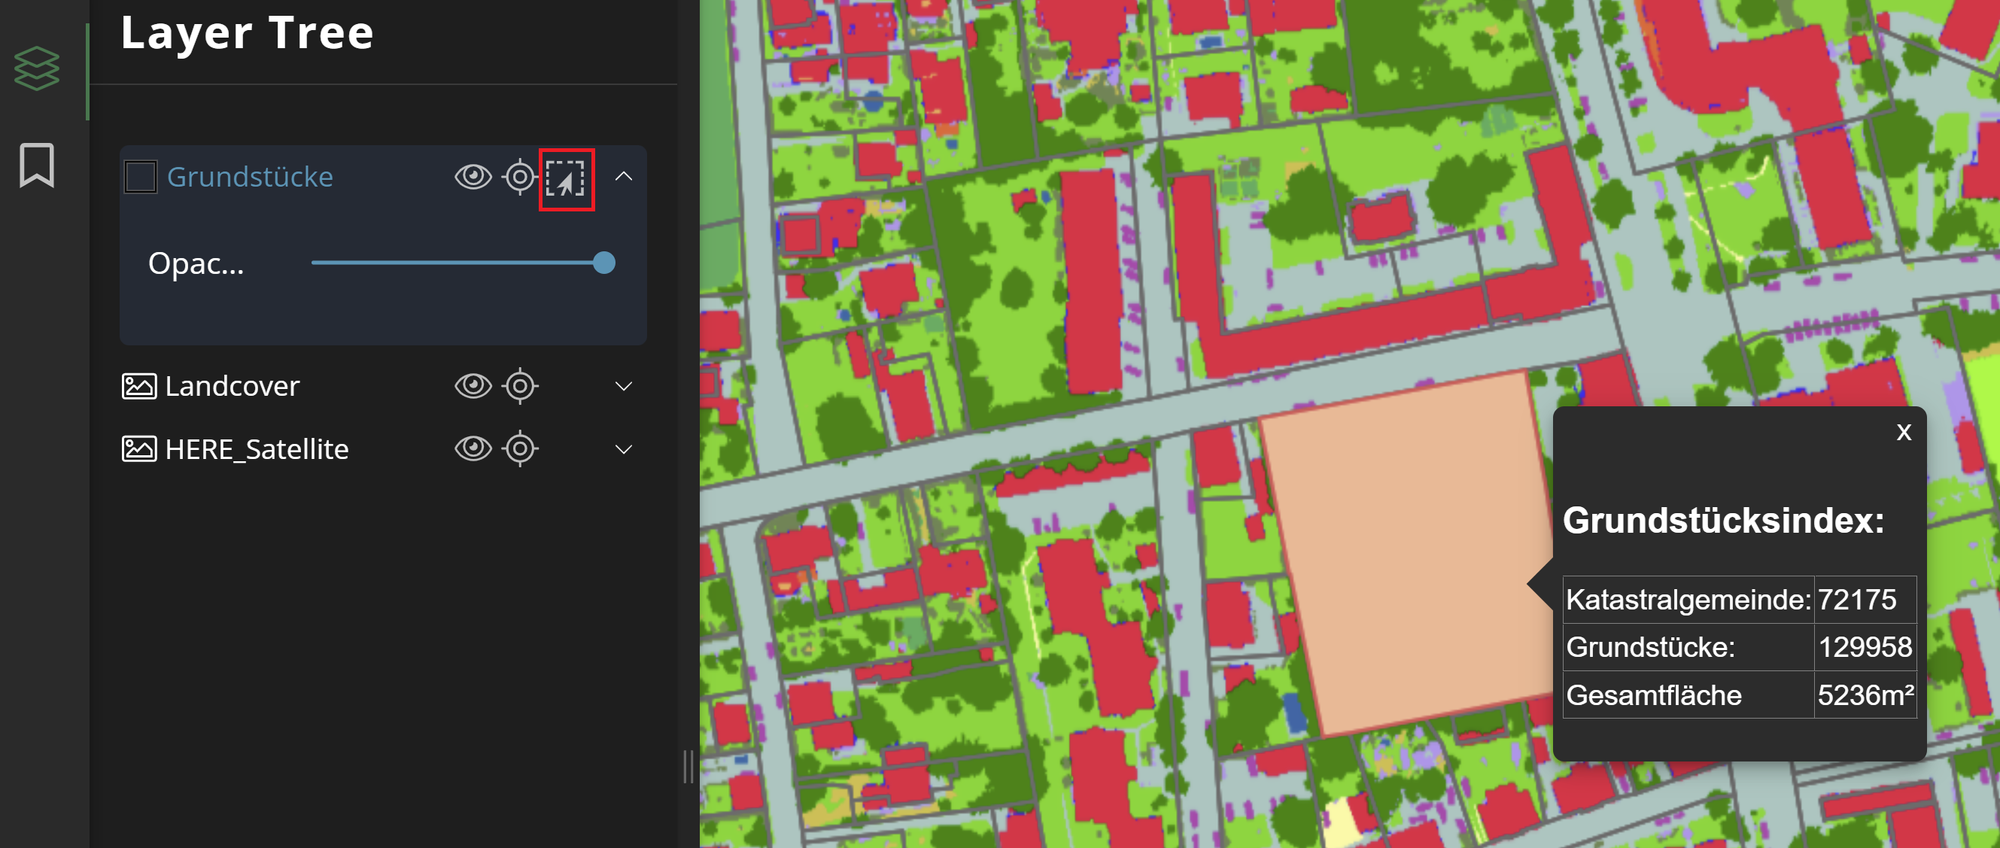
2. Defining a tooltip in Dashboard
Another option to create a tooltip for one of your layers can be found directly in the Dashboard editor. In the menu bar, select the icon that looks like a speech bubble. When you hover over the icon with the mouse, it displays Tooltips.

A window, such as the one below, with tooltip settings will appear.
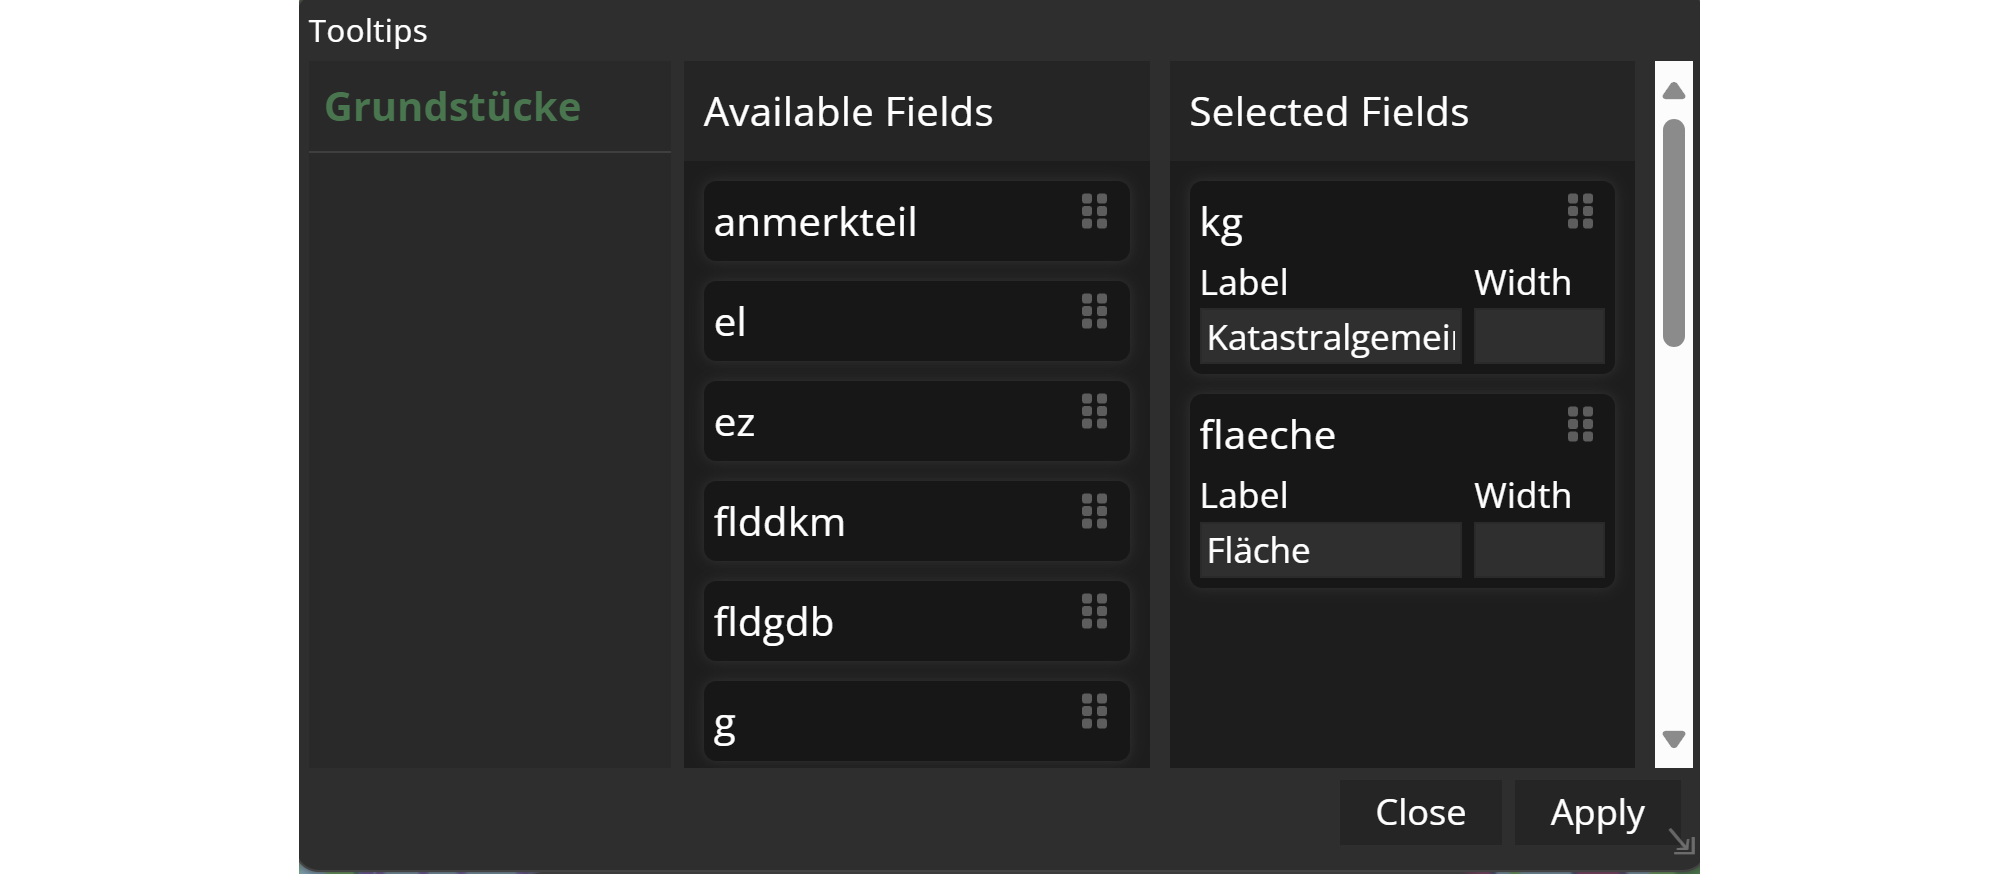
You can see the available layers on the left, in this example "Grundstücke". For each layer its attribute fields will be displayed in the list of available fields. You can select attributes for the tooltip by dragging and dropping them to the right.
Choose as many fields as desired by just one click!
Moreover, you can define a label for the attributes, which will be shown in the tooltip window. Click Apply and be sure to save it afterwards!
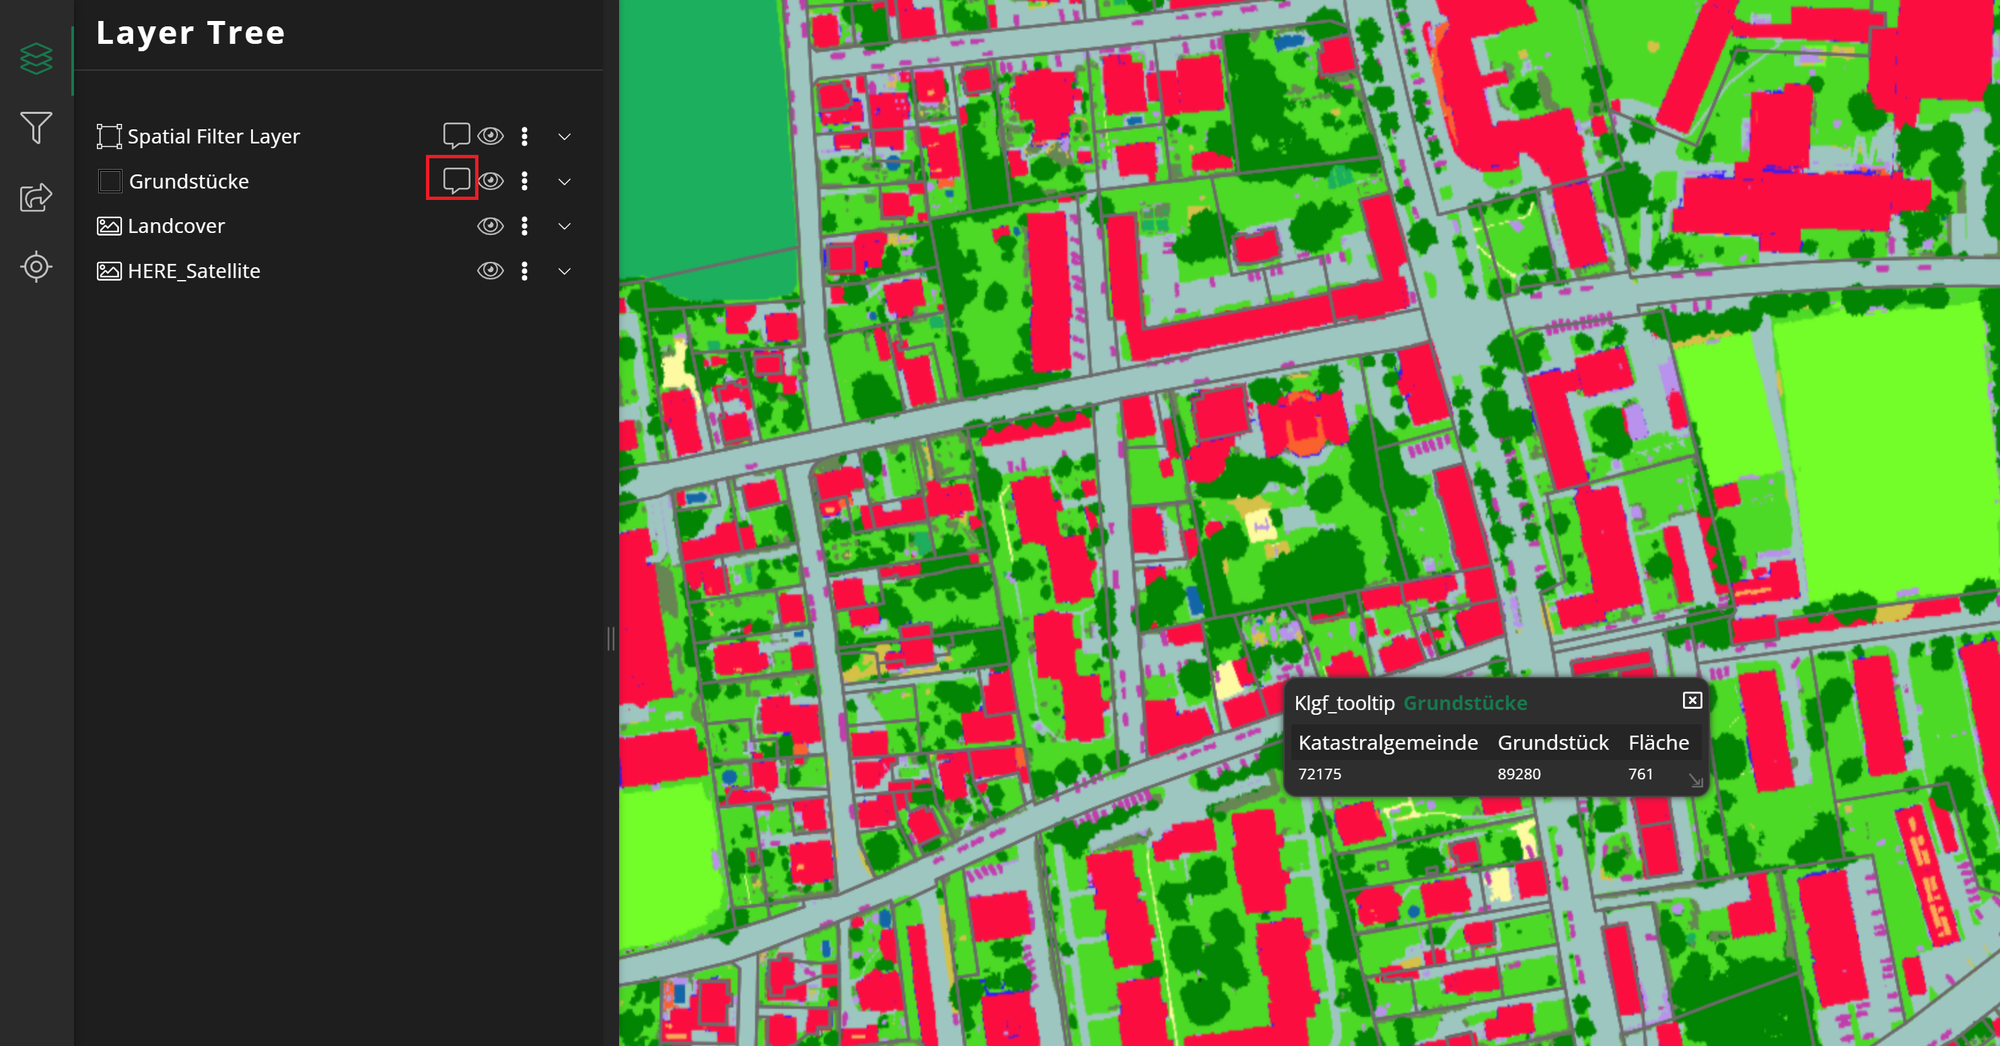
Joined datasets' tooltip
With a dataset join in the dataset configuration section of Dashboard, it is possible to have additional attributes available for a tooltip. The prerequisite for a join is that the data being linked must have a common attribute or key field.
Detailed information on the data join can be found in the following content post.
Marina LanxingerDefining Studio and Dashboard tooltips
This option assumes that you both generate a tooltip in Studio and one in the Dashboard Editor, meaning you have defined a tooltip twice.
The instructions to generate both can be found in the sections above.