This tutorial will outline the possibilities to combine a styling from your map view in Dashboard with a theme widget and vice versa.
There are two ways to apply the same styling to both widgets.
-
Either you have a specific styling for your Luciad RIA content and you want to show an appendant theme chart that matches the colors.
Luciad RIA to Theme Chart -
Or your starting point is a theme chart with customized colors and you also want to use these colors in the Luciad RIA widget
Theme Chart to Luciad RIA
Colormatching a theme chart
To start with, you will have to create a styleset for your Dashboard map, unless you are already using one and make sure that your dataset is in your Dashboard legend.
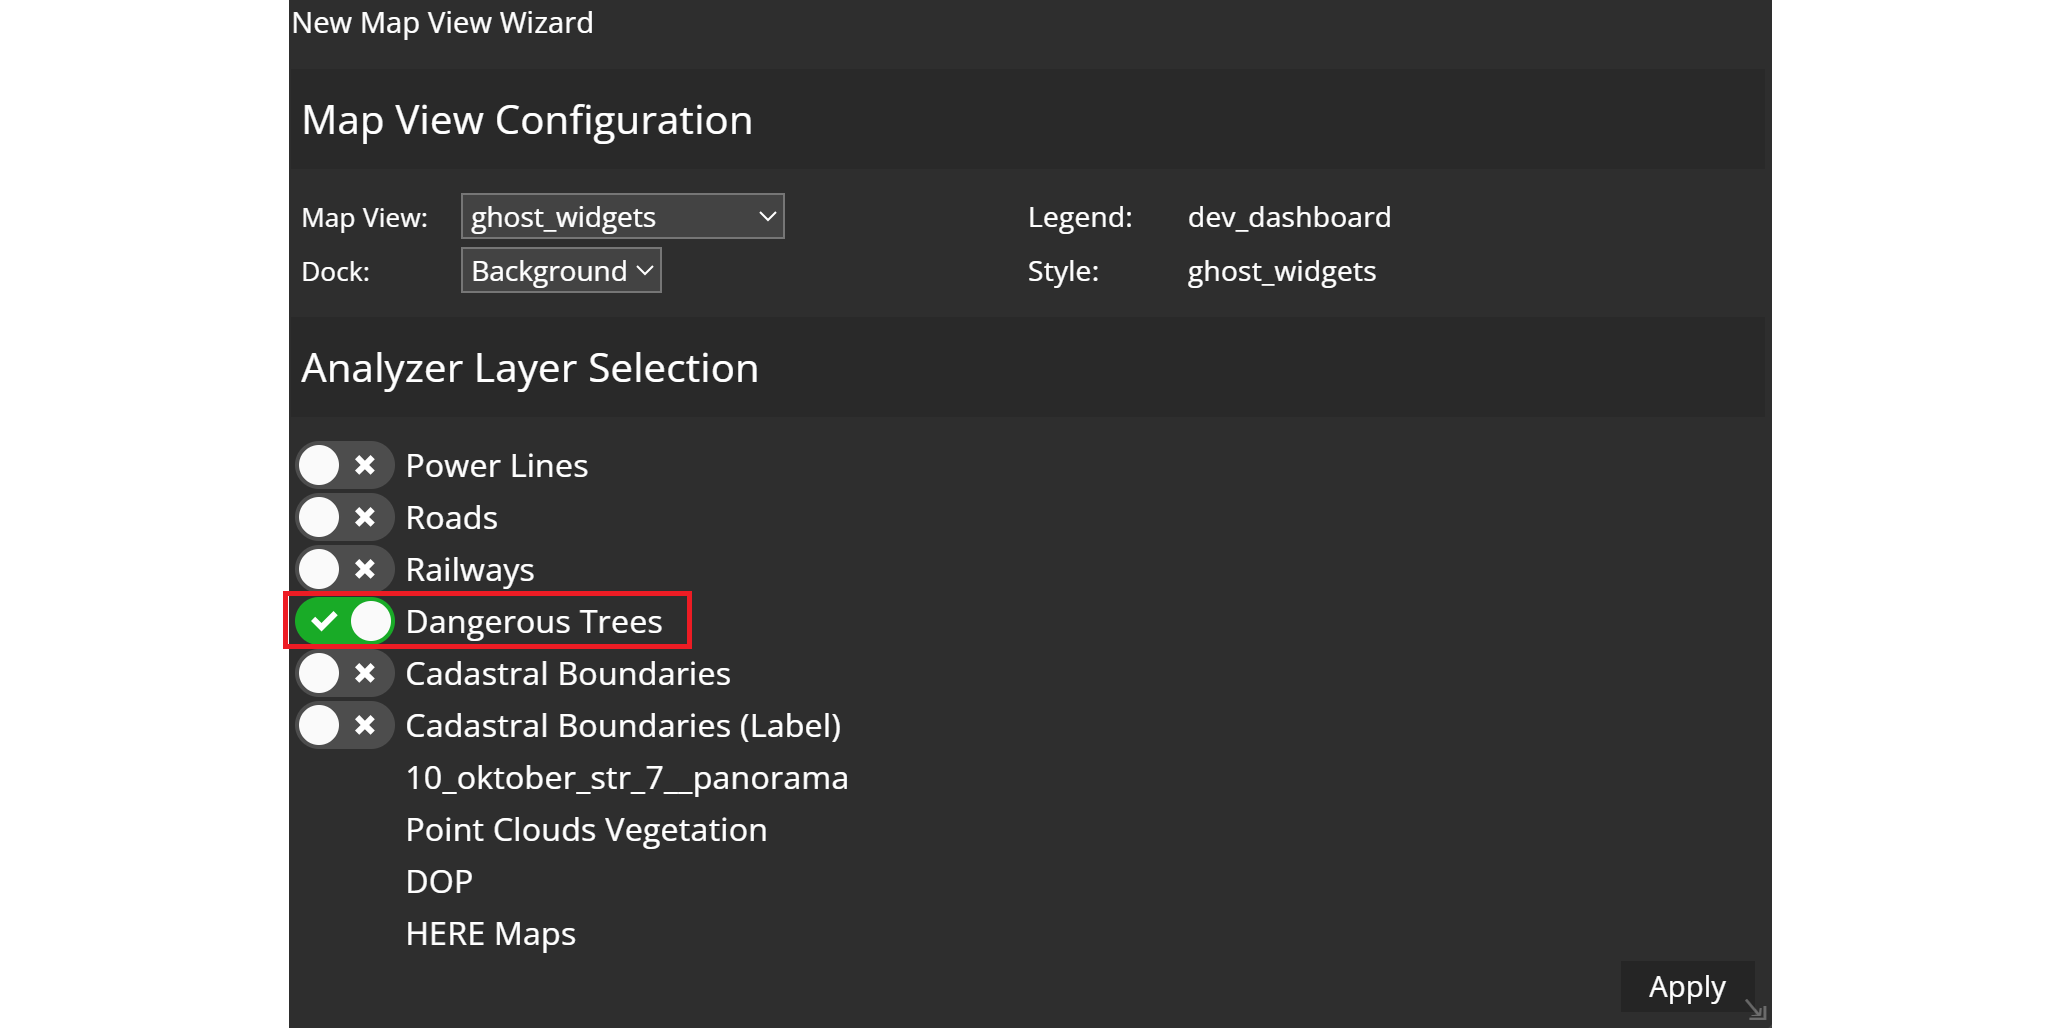
When you configure your Dashboard, make sure that you select the dataset, on which your styleset is based, as an analyzer layer.
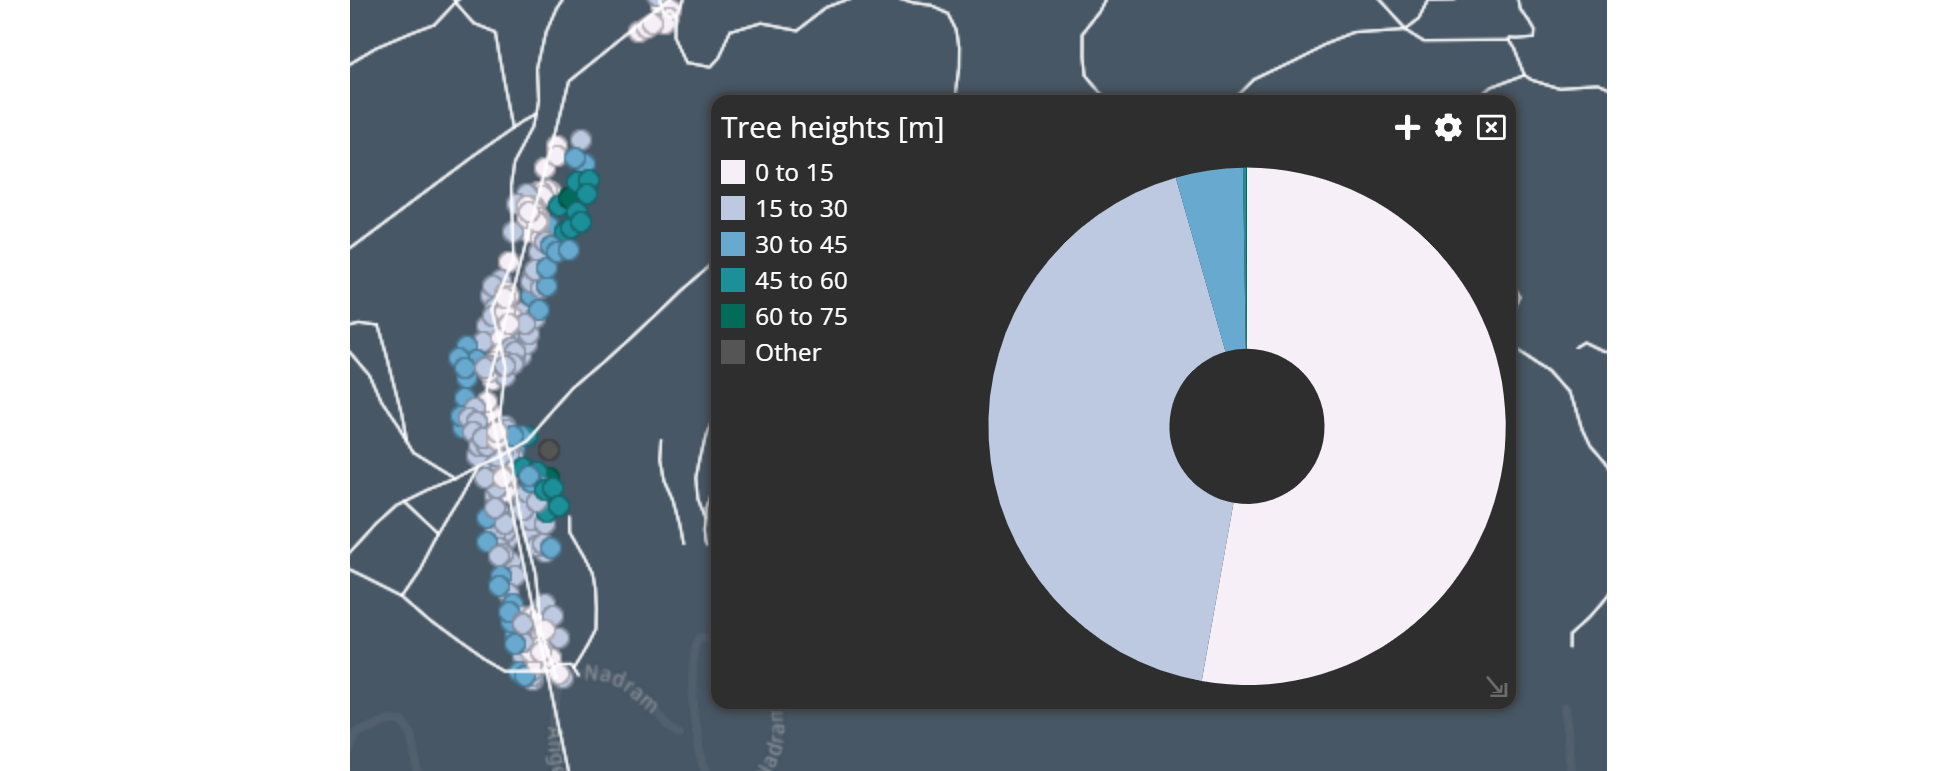
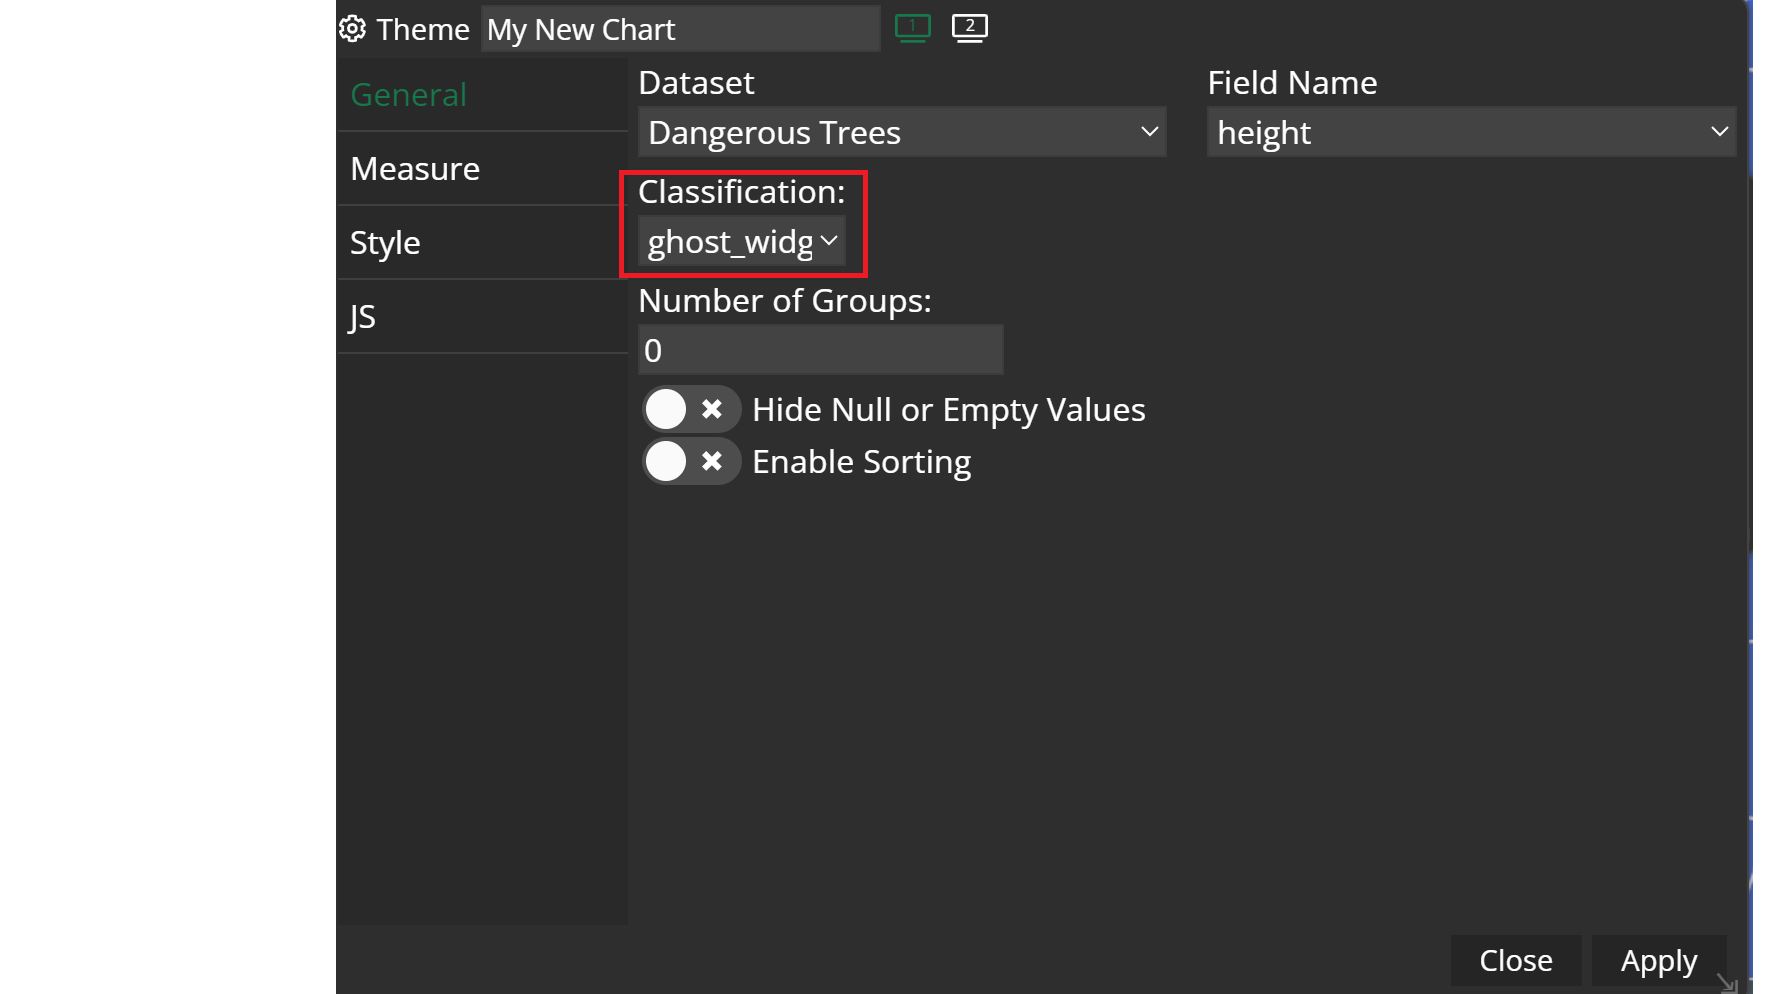
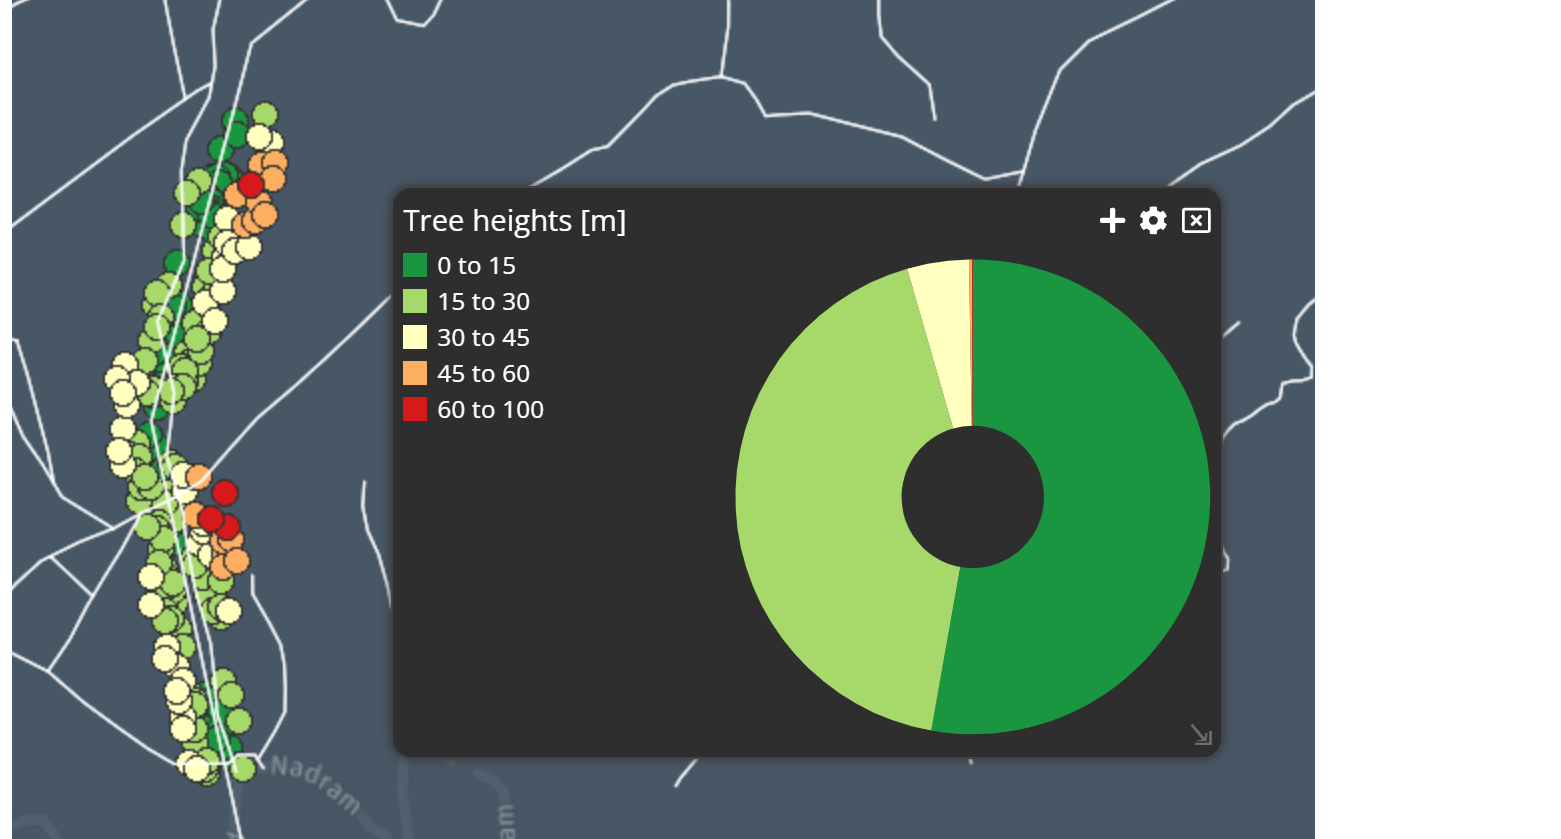
Thereafter, you can start and create a Theme widget. Use the according dataset and choose the attribute that matches your styleset. For the classification select your stylset and click apply. You will now see that the filters and colors of your map style are perfectly adjusted to the chart's coloring.
Colormatching Luciad RIA
In this process, you have a theme chart with customized colors or any styling from the default options and you want to transfer these colors to the map.
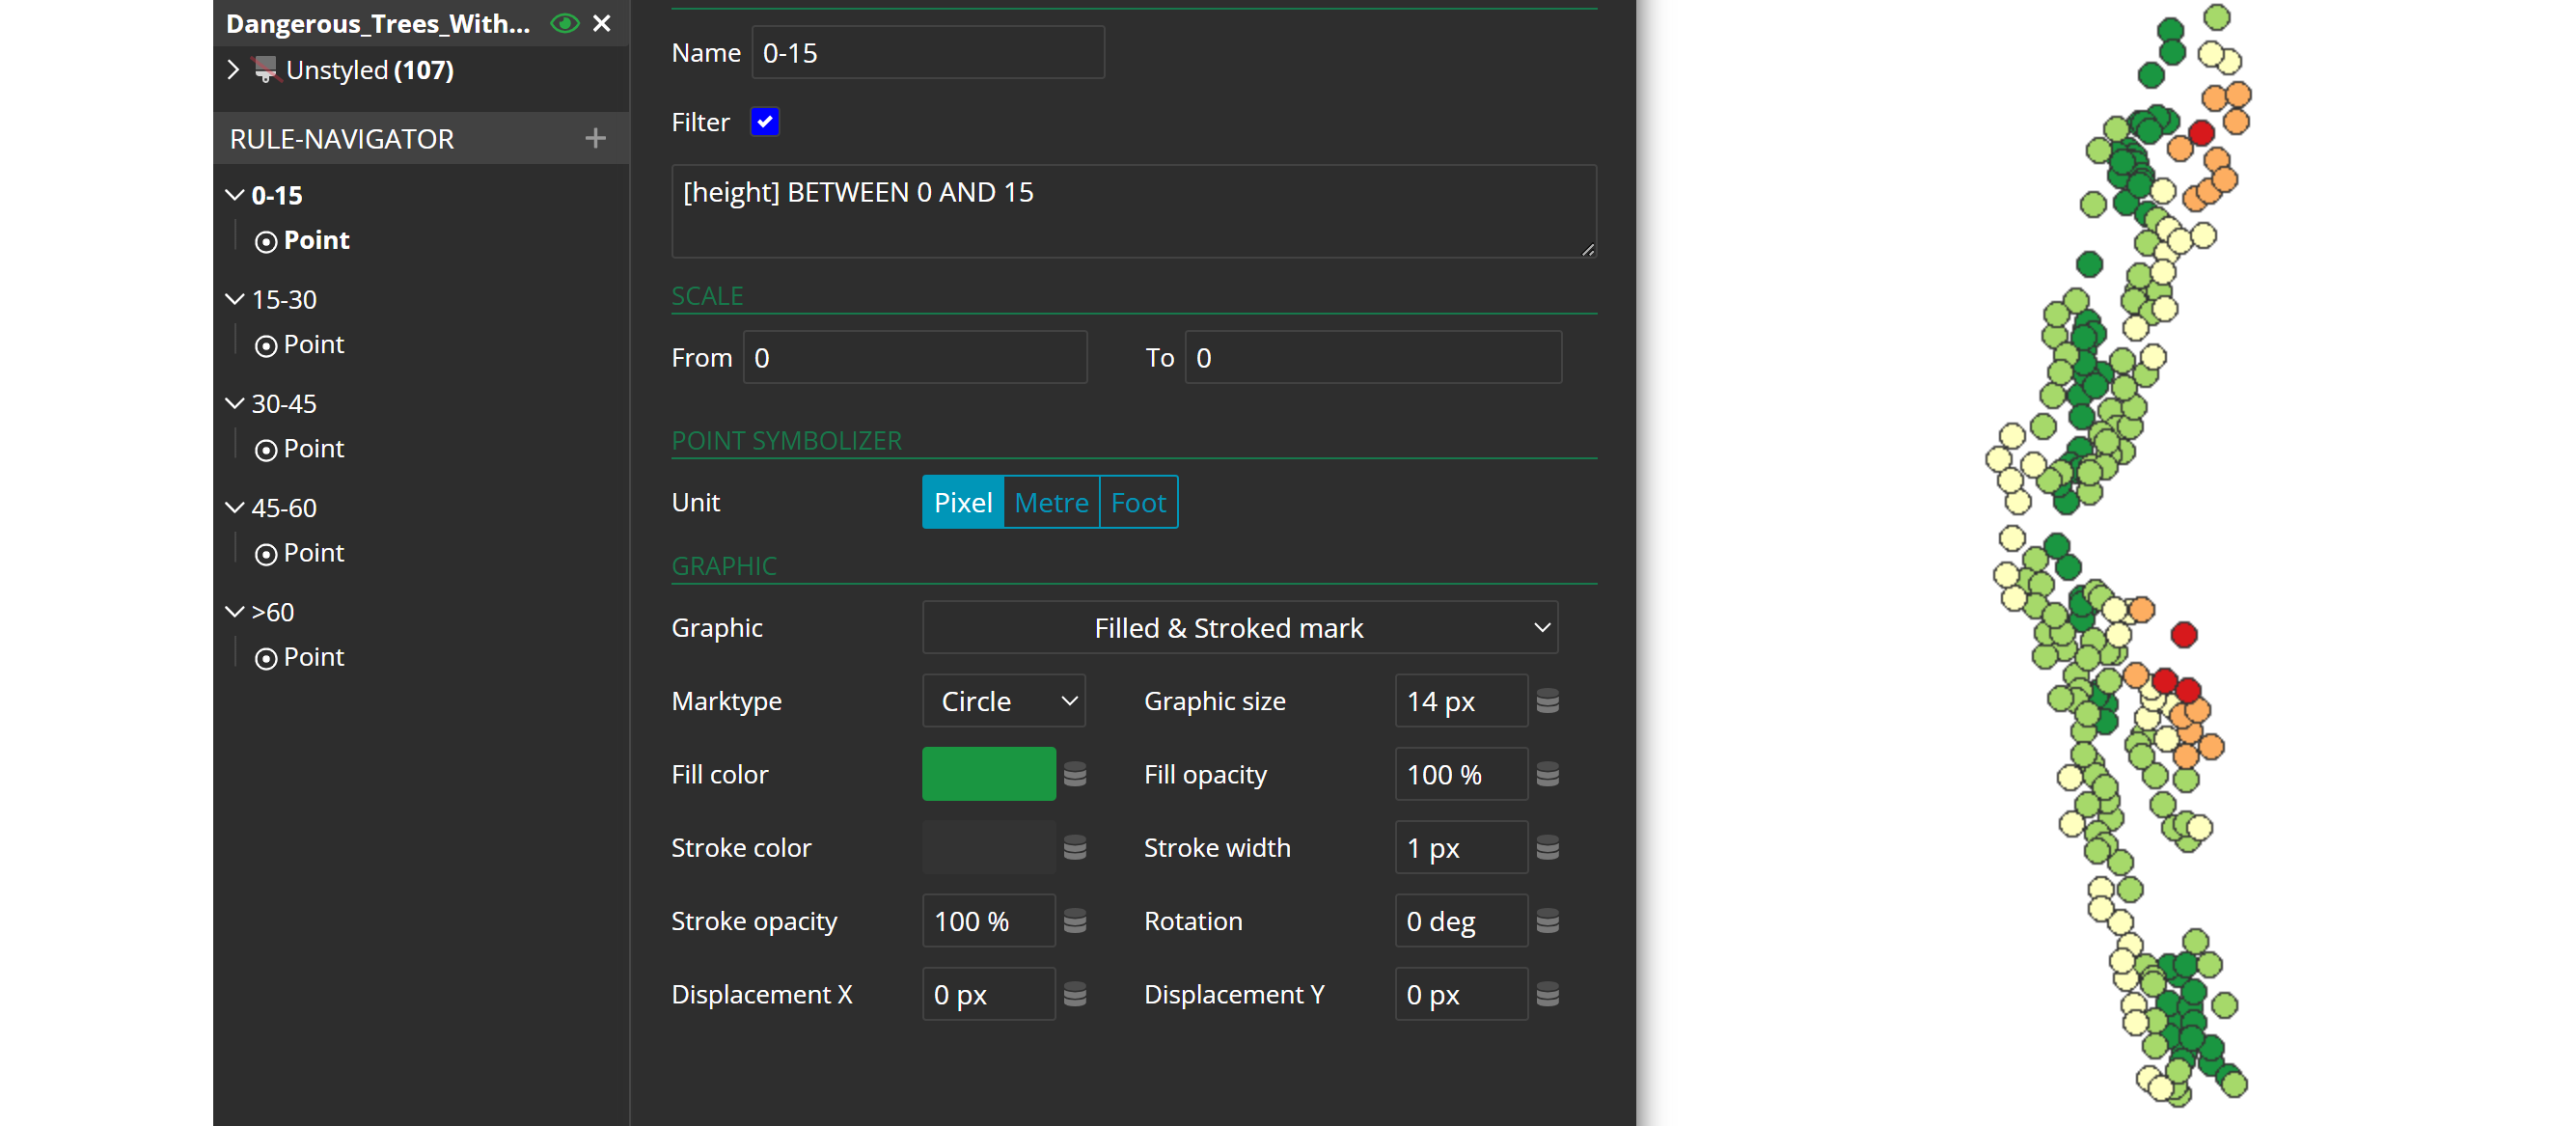
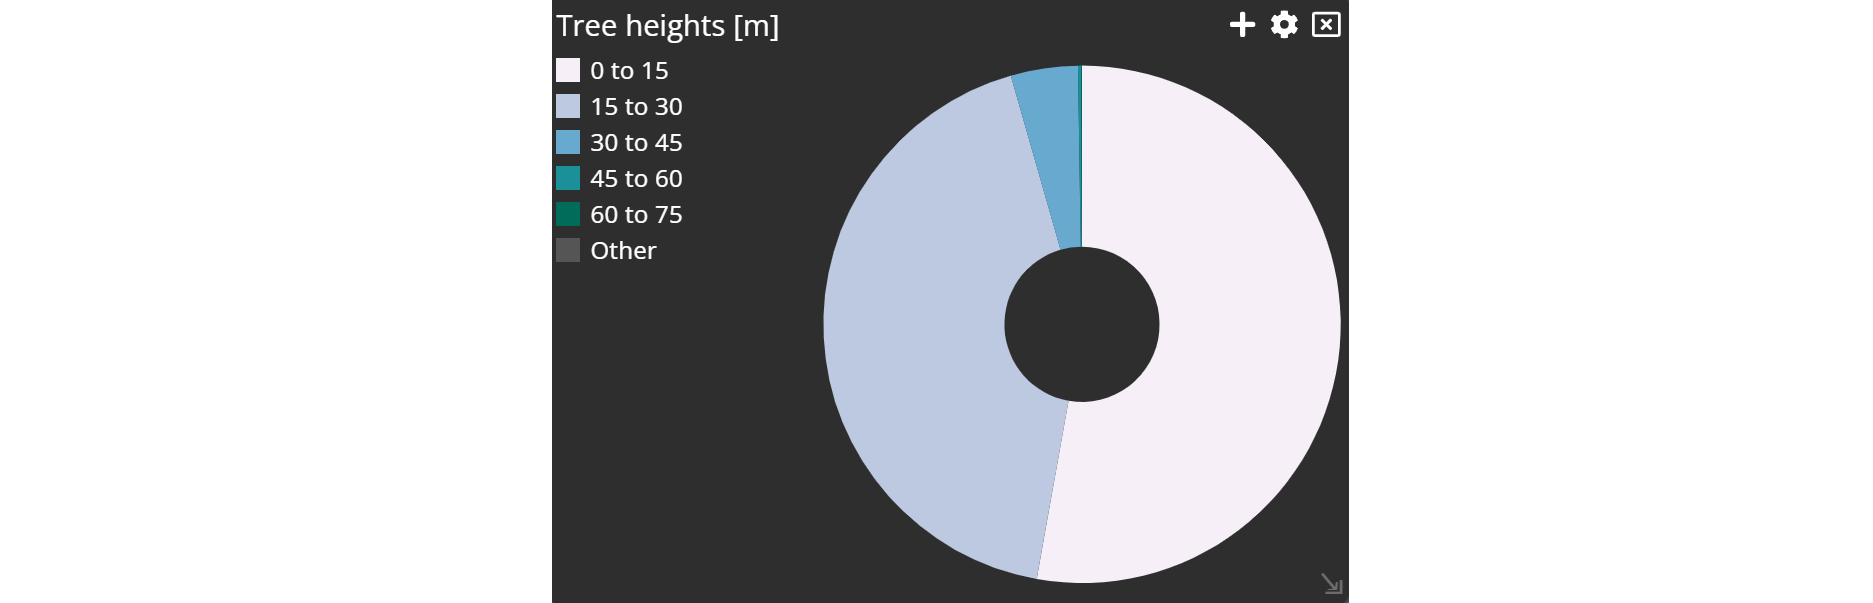
Create a theme chart and categorize and style it as you desire. For example you could use this kind of styling:
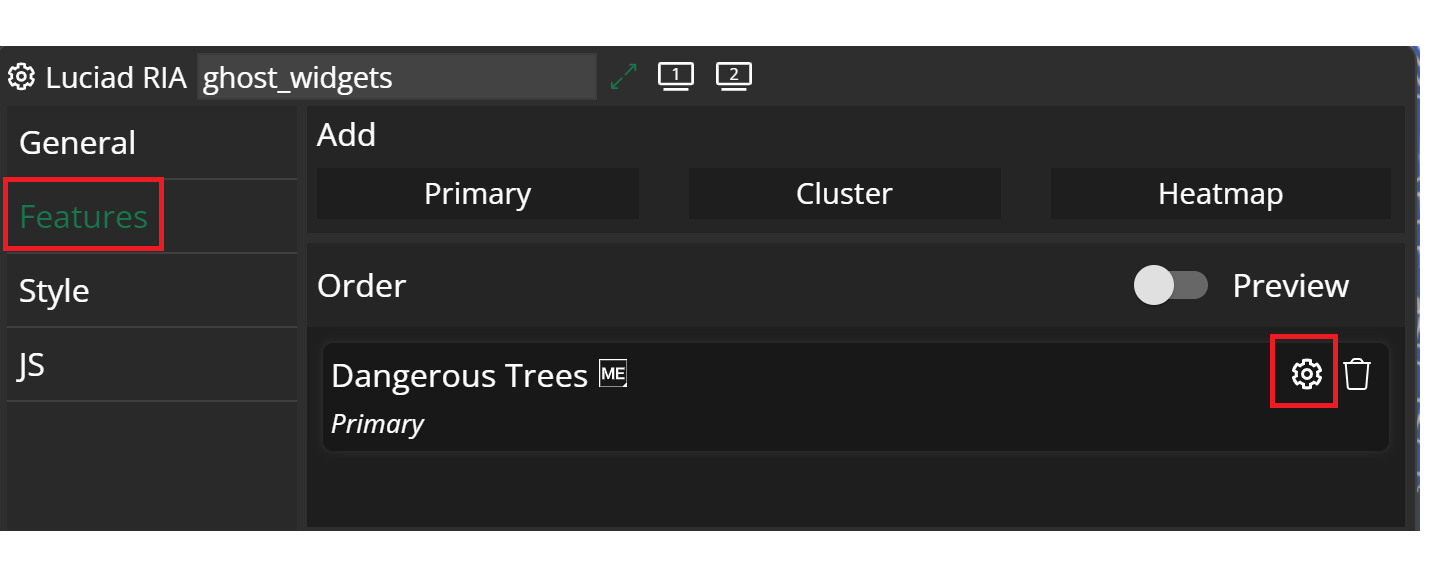
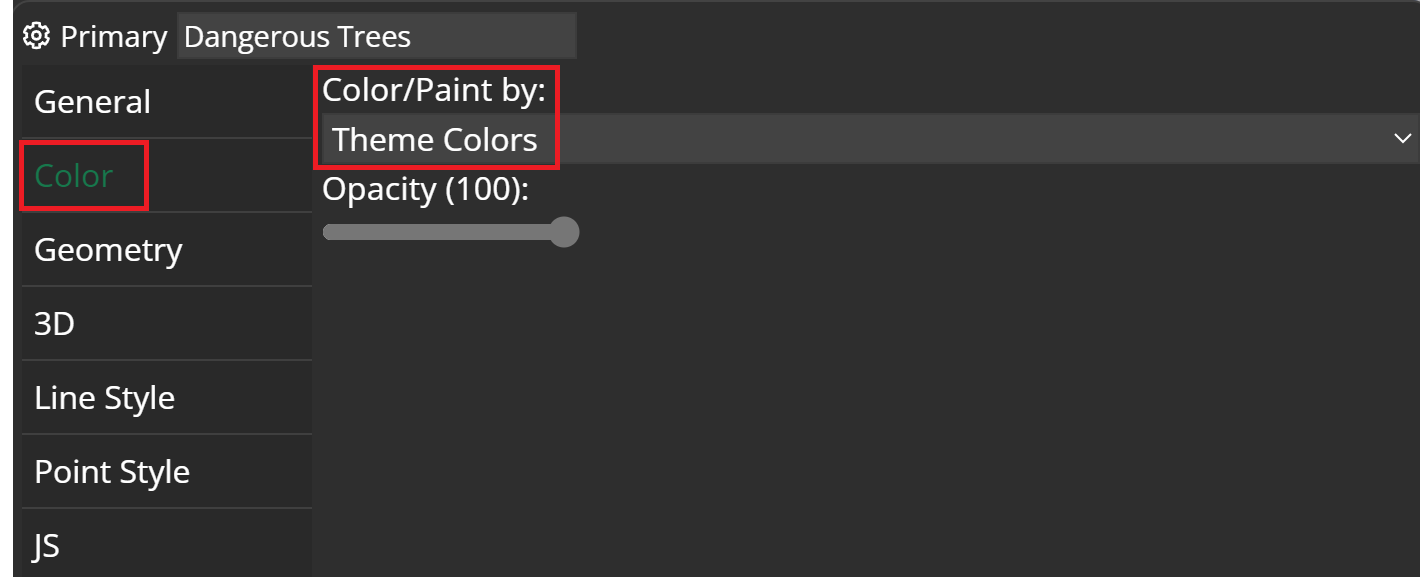
Luciad RIA widget → configuration → features → settings
Navigate to the configuration menu of the Luciad RIA widget and click on settings icon next to your dataset within the features tab. You will be forwarded to the dataset configuration. There you have to navigate to the color tab and select Theme Colors for the Color/Paint by setting.
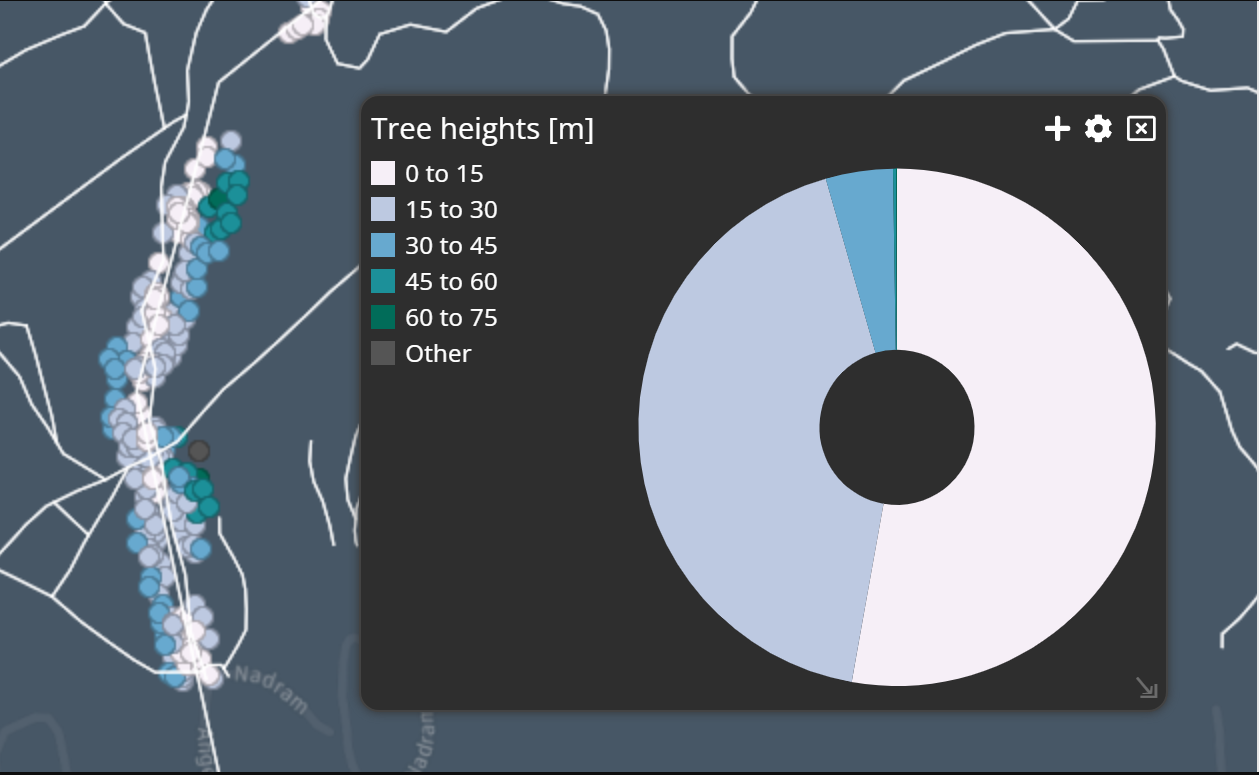
Once you have applied the style, you will see the coordinated widgets. The geometry points in the map are matching your theme chart.