
In this article, we will demonstrate how you can efficiently highlight objects in 3D within an M.App Enterprise Dashboard.
Dashboards provide an effective means to gain new insights into our data. Several dashboards have already been created with a variety of data for analysis. However, these dashboards primarily focus on 2D representations of the features, as illustrated below:
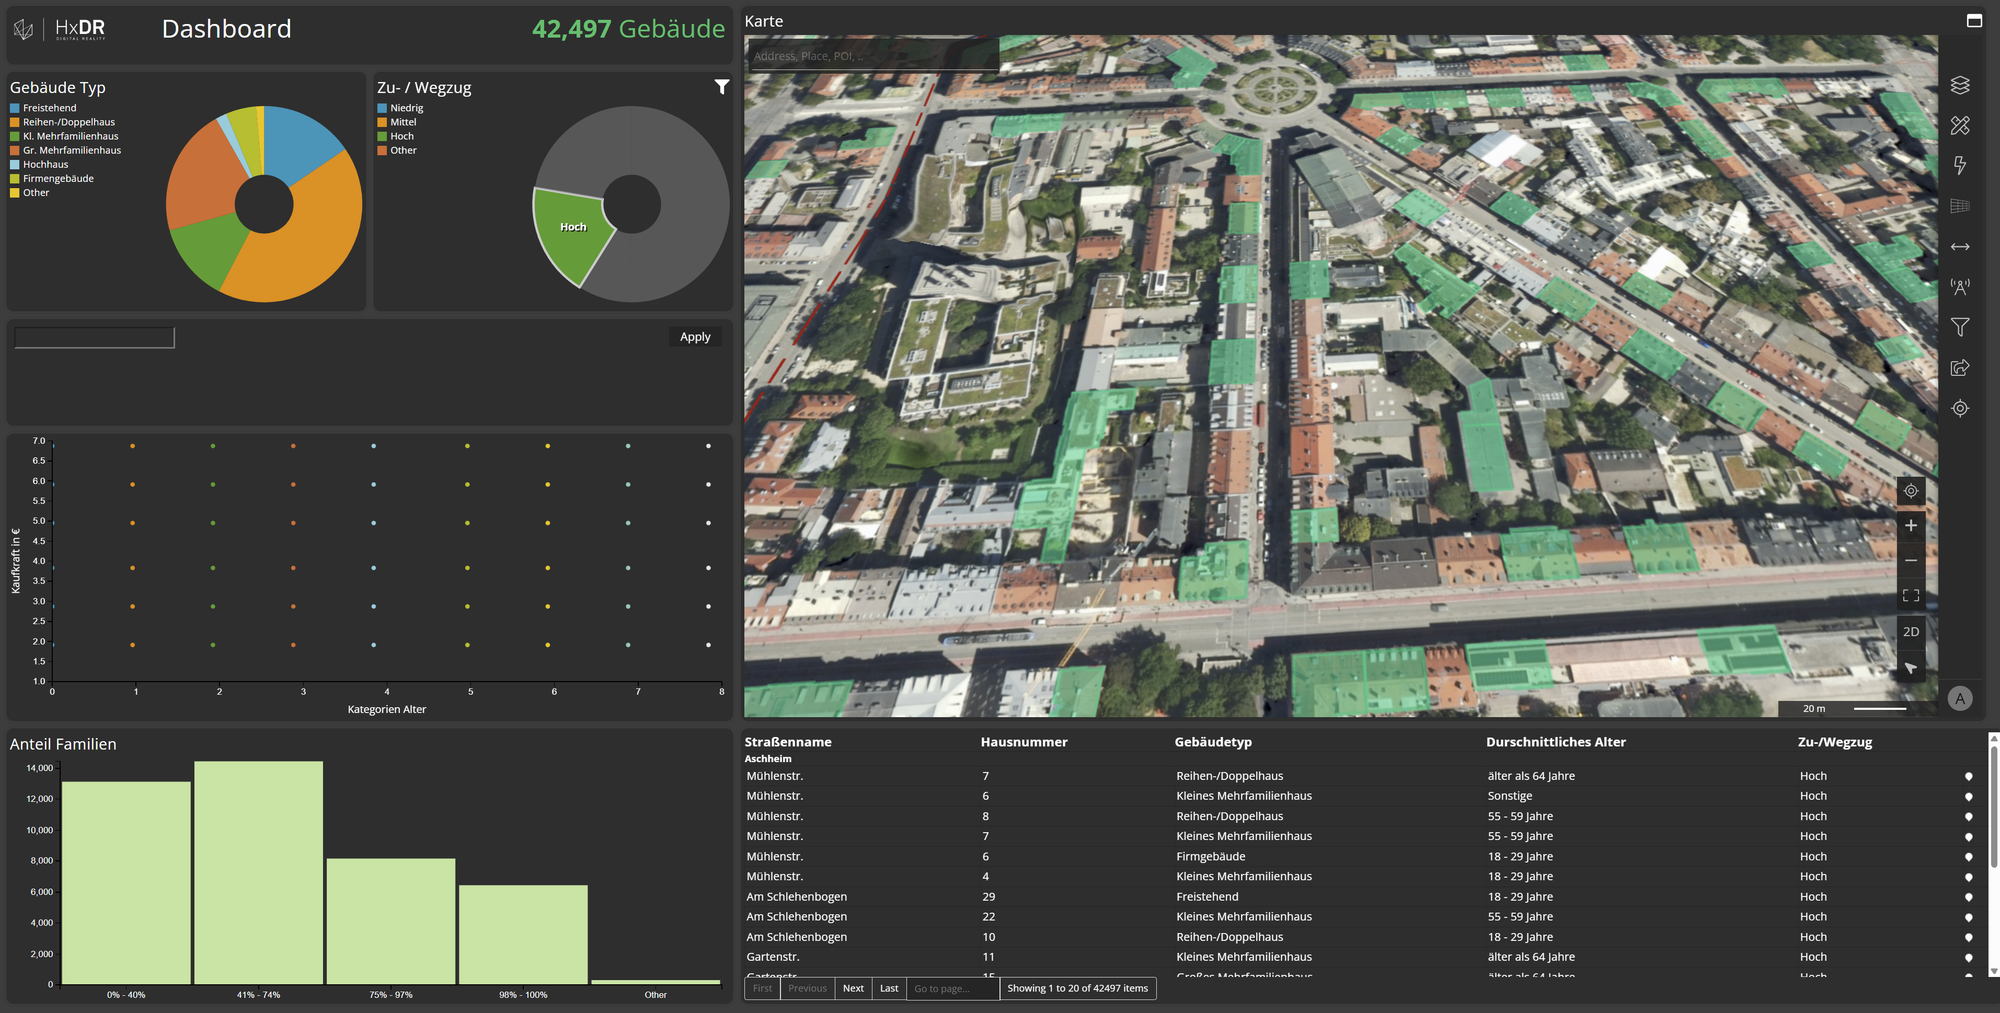
In the dashboard above, all buildings within Munich are visualized according to user-defined filter criteria. It would be beneficial to also display the found objects within a 3D mesh. Therefore, let’s enable the mesh layer:
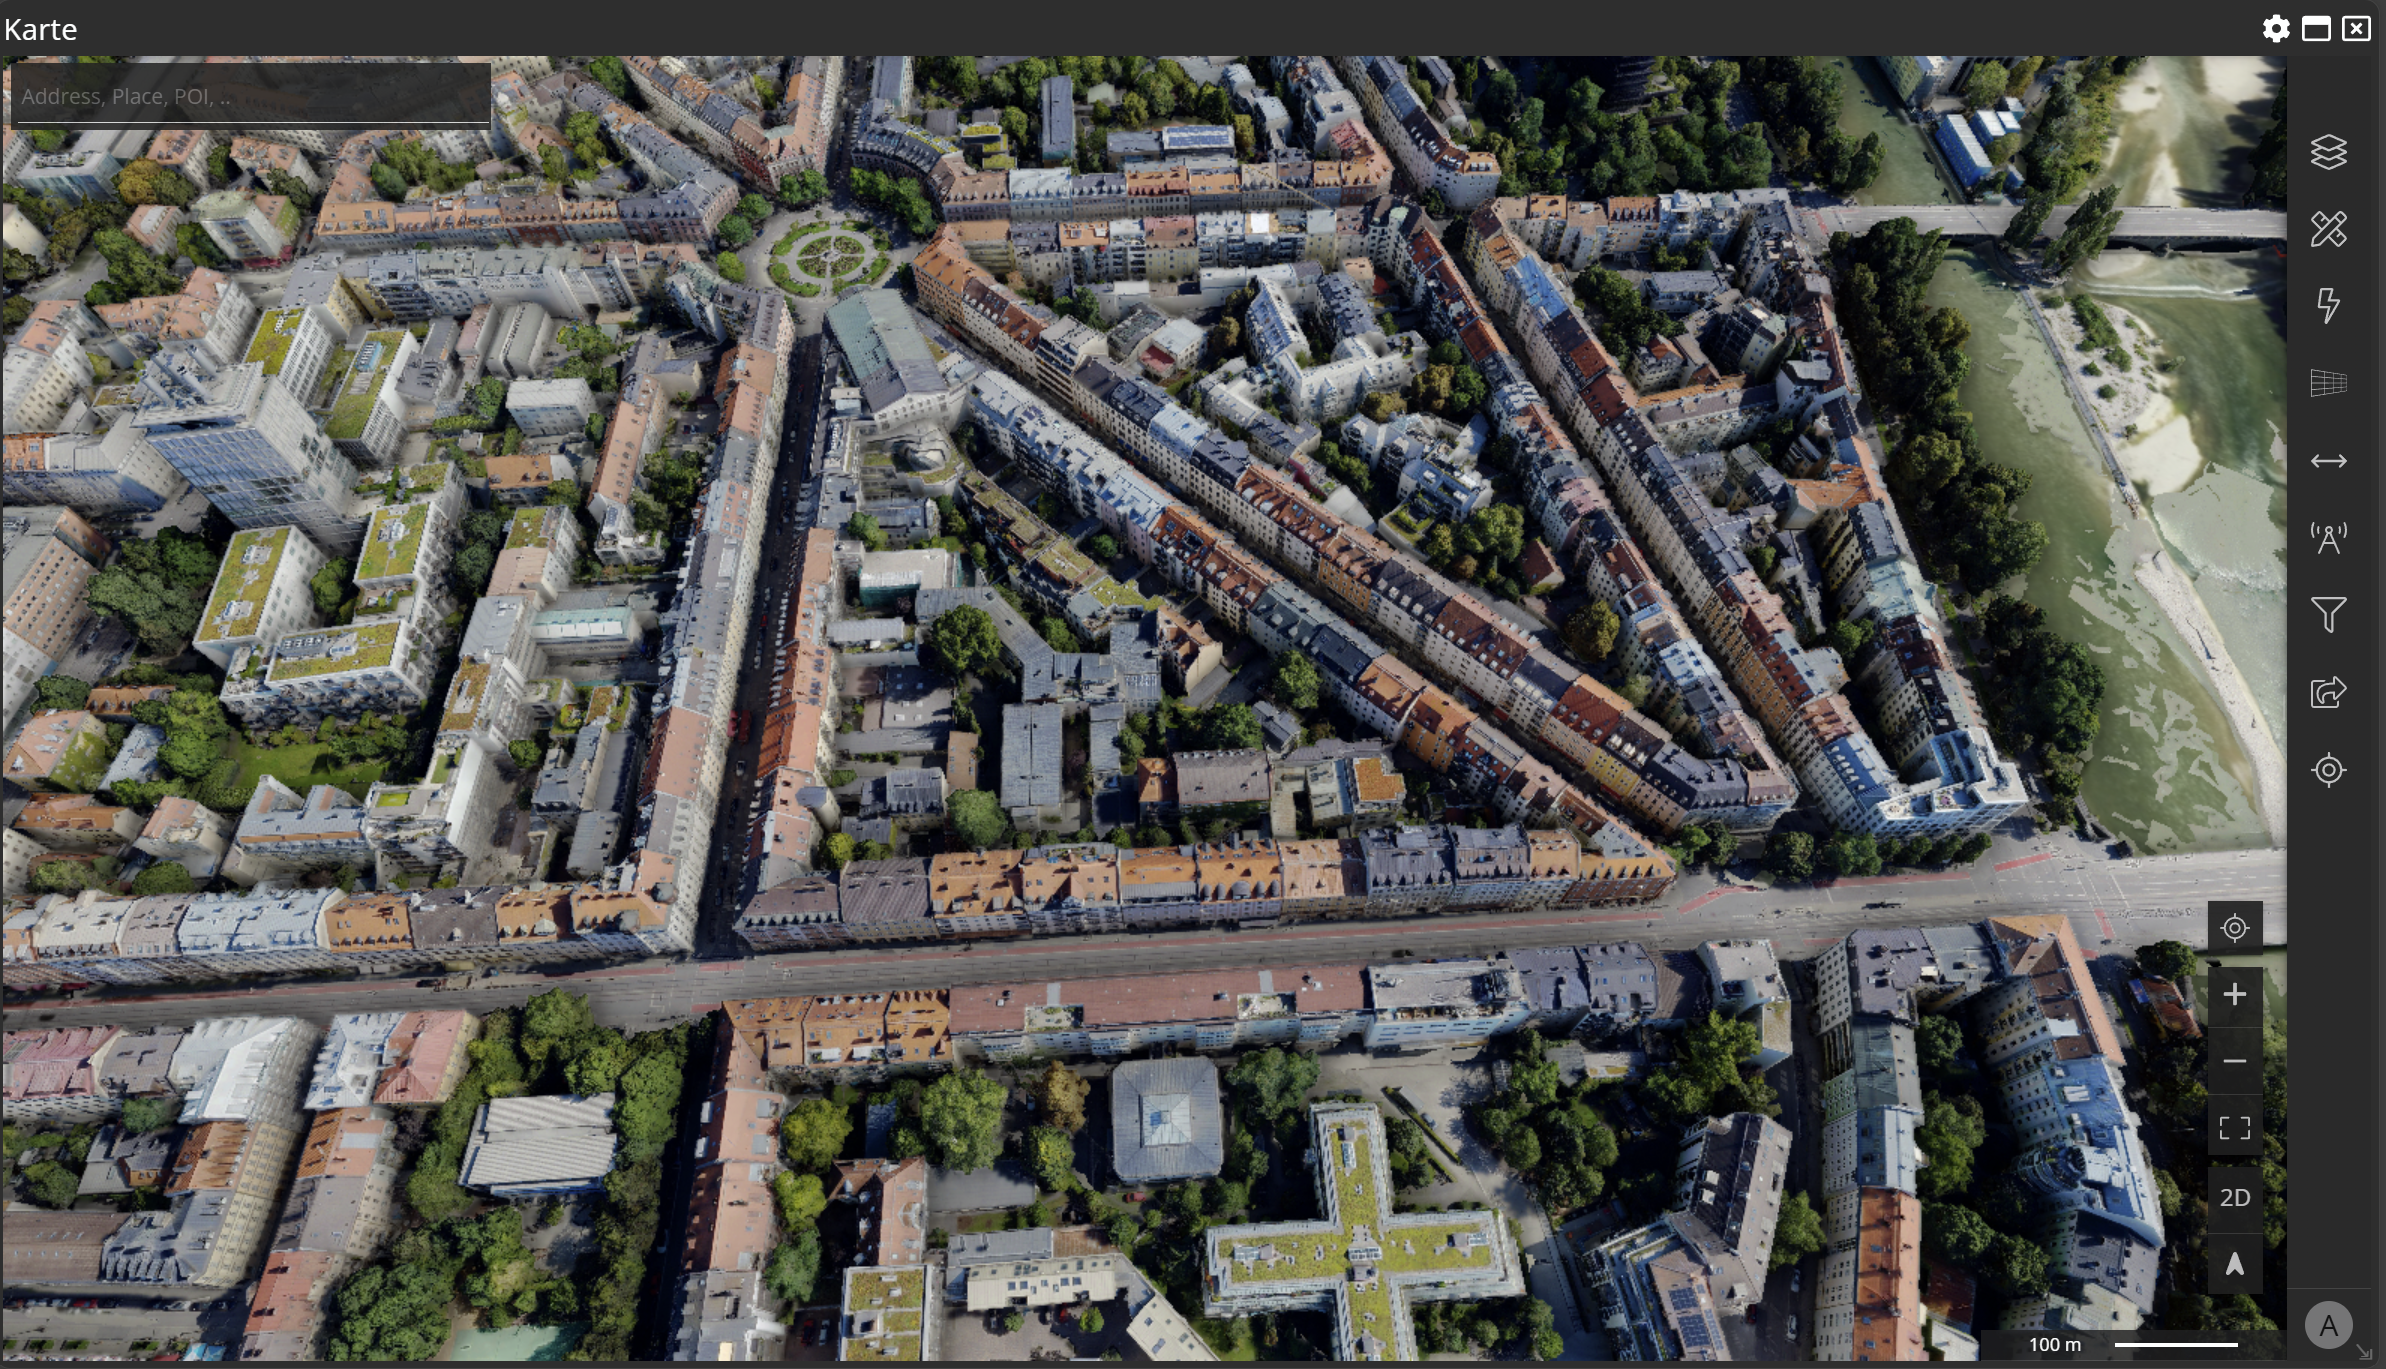
As illustrated in the image, the mesh currently obscures all vector data within the map, as the vector data are draped over the elevation model while the mesh layer overlays them. This can be amended with a minor modification in the JavaScript of our Dashboard map:
- Open the Dashboard editor in the M.App Enterprise Studio.
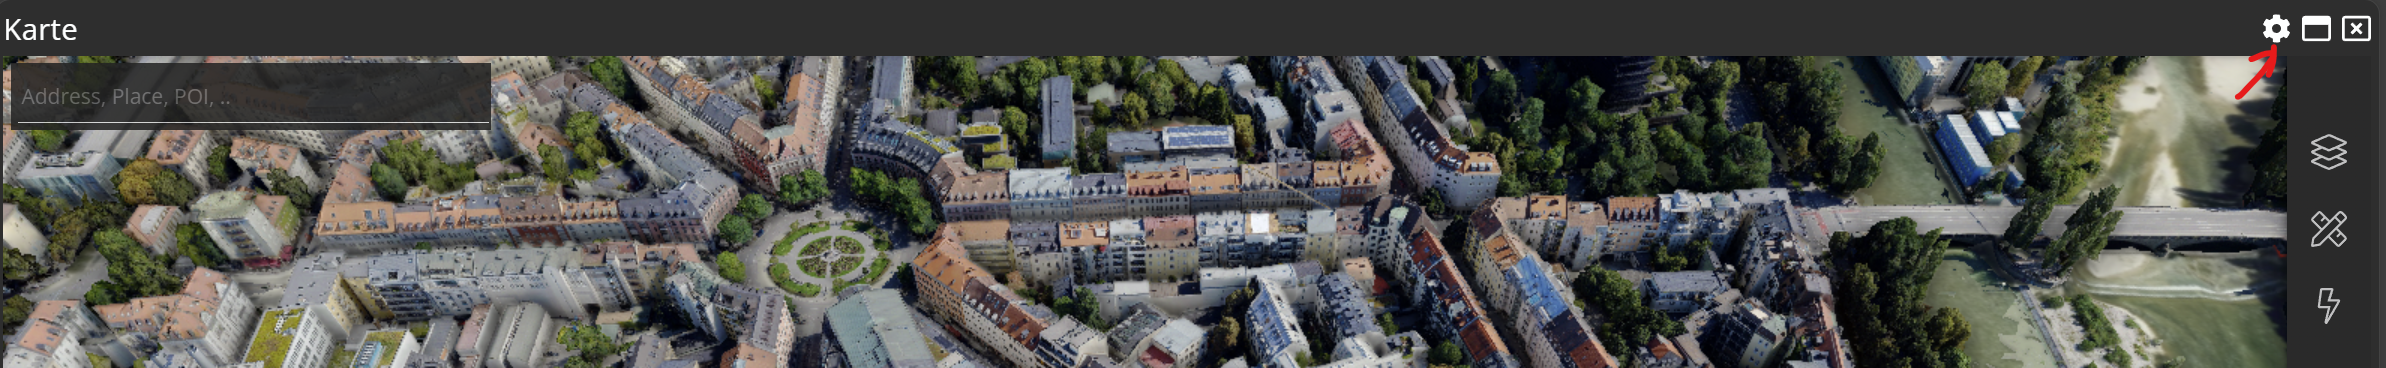
- Click on the configure button of your map widget:
- Change to the JS tab on the left:
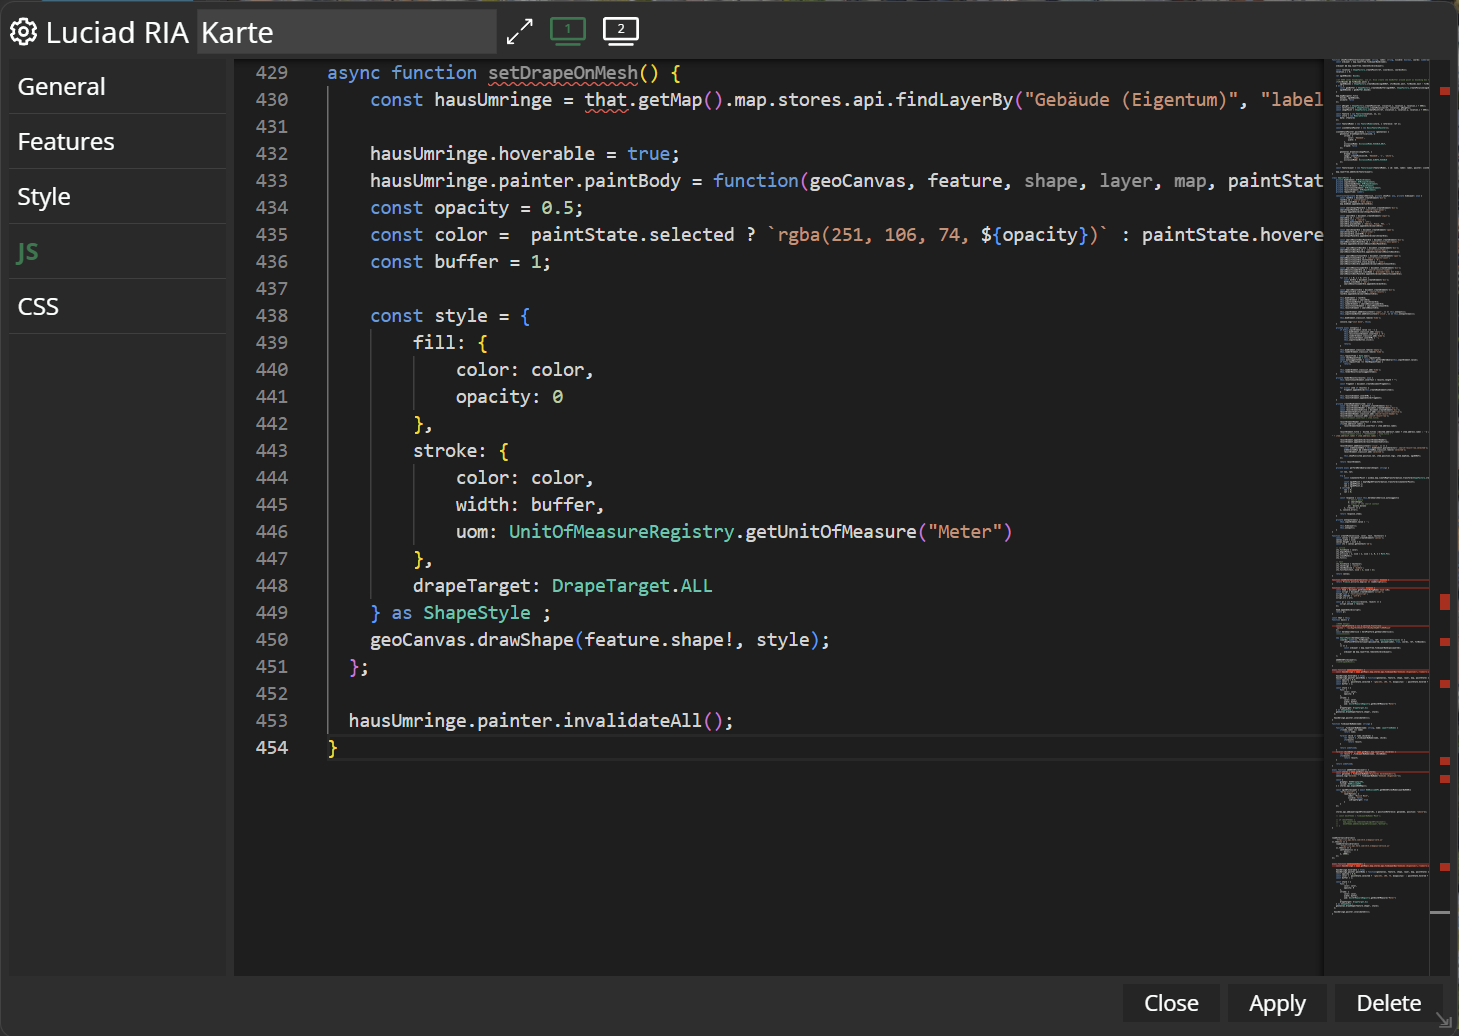
- Add the JavaScript so that your vector data are draped on top of the mesh:
setDrapeOnMesh();
async function setDrapeOnMesh() {
    const that = this;
    const hausUmringe = that.getMap().map.stores.api.findLayerBy("Gebäude (Eigentum)", "label") as FeatureLayer;

    hausUmringe.hoverable = true;
    hausUmringe.painter.paintBody = function(geoCanvas, feature, shape, layer, map, paintState) {
        const opacity = 0.5;
        const color =  paintState.selected ? `rgba(251, 106, 74, ${opacity})` : paintState.hovered ? `rgba(255, 237, 160, ${opacity})` : `rgba(29, 207, 133, ${opacity})` ;
        const buffer = 1;

        const style = {
            fill: {
                color: color,
                opacity: 0
            },
            stroke: {
                color: color,
                width: buffer,
                uom: UnitOfMeasureRegistry.getUnitOfMeasure("Meter")
            },
            drapeTarget: DrapeTarget.ALL
        } as ShapeStyle ;
        geoCanvas.drawShape(feature.shape!, style);
    };
    hausUmringe.painter.invalidateAll();
}
- Save your new dashboard configuration.
Upon reloading the dashboard and making the mesh layer visible, our data is now displayed over the 3D mesh:
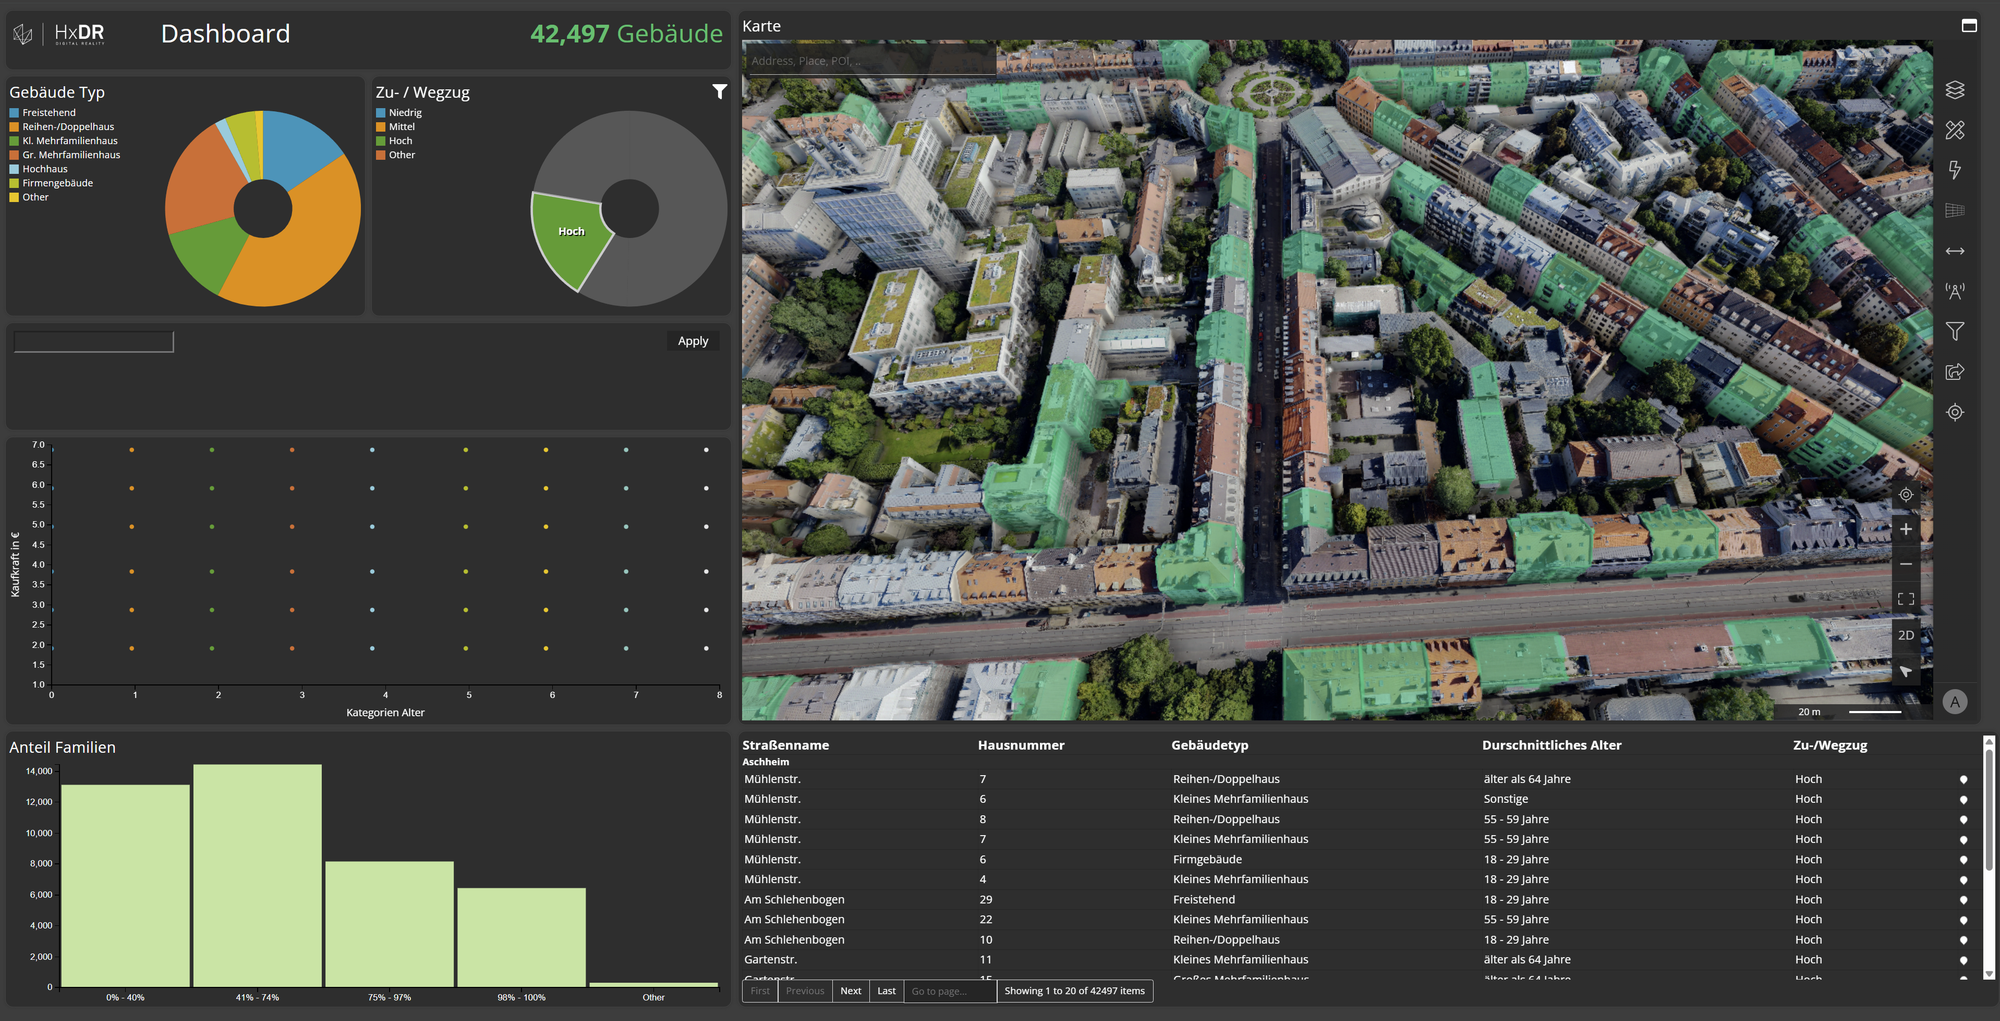
The same code snippet can be utilized in other M.App Enterprise Browser Applications to overlay vector data onto mesh data. For further information on rendering in RIA, please refer to the RIA Documentation Portal.