Creating beautiful tooltips in M.App Enterprise
POSTED: | UPDATED: | by Markus Holler
In this tutorial you will learn to create a more complex tooltip including icons and database values.
Introduction
We all love beautiful user interfaces and with that today we want to highlight how you can easily setup a tooltip to present a lot of information in a visually compelling way.
In this example we need to present information about the usage of parcels within the city of Klagenfurt and we assume that the database table is already available in our Postgre instance. Also, the feature class is already imported to MAE and added to our legend. If you want to learn more how this parcel index was calculated, I highly recommend to read the following blog post about the project:
 Marina Lanxinger
Taking a look on our table we do see following definition:
| Column name | Type |
|---|---|
| id | integer |
| geometry | USER-DEFINED |
| kg | bigint |
| gst_nr_con | text |
| geom_flaec | numeric |
| tree_max | numeric |
| green_vol | numeric |
| green_idx | numeric |
| imper_perc | numeric |
| ground_build | numeric |
| ground_object | numeric |
| ground_imper | numeric |
| ground_notsealed | numeric |
| ground_water | numeric |
Basics
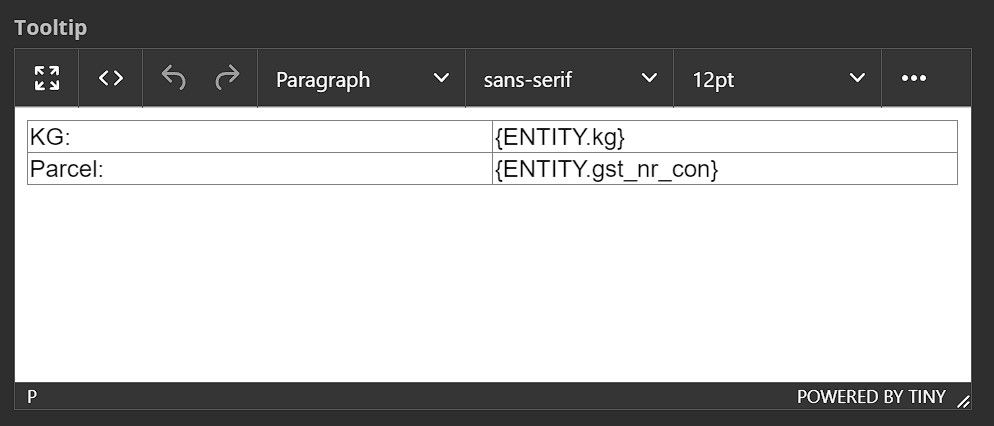
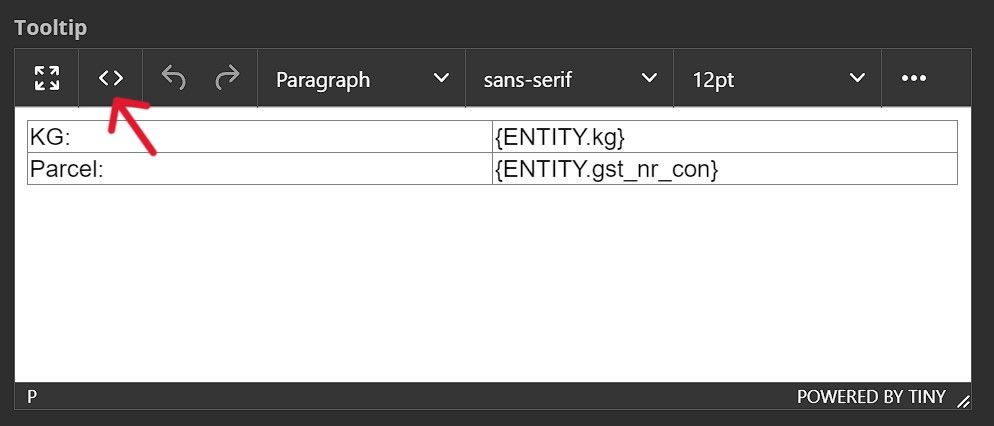
Let's start with a simple tooltip definition where we want to show the official identifier of the parcel. For that, in Austria we need to visualize the unique identifier of the commune (column kg) and the parcel number (column gst_nr_con) itself. The definition in the MAE Studio would look like this:
KG: {ENTITY.kg}
Parcel: {ENTITY.gst_nr_con}
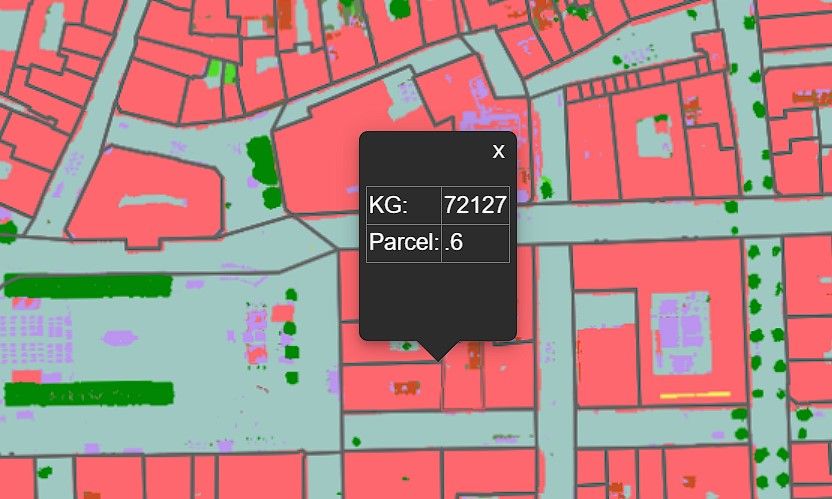
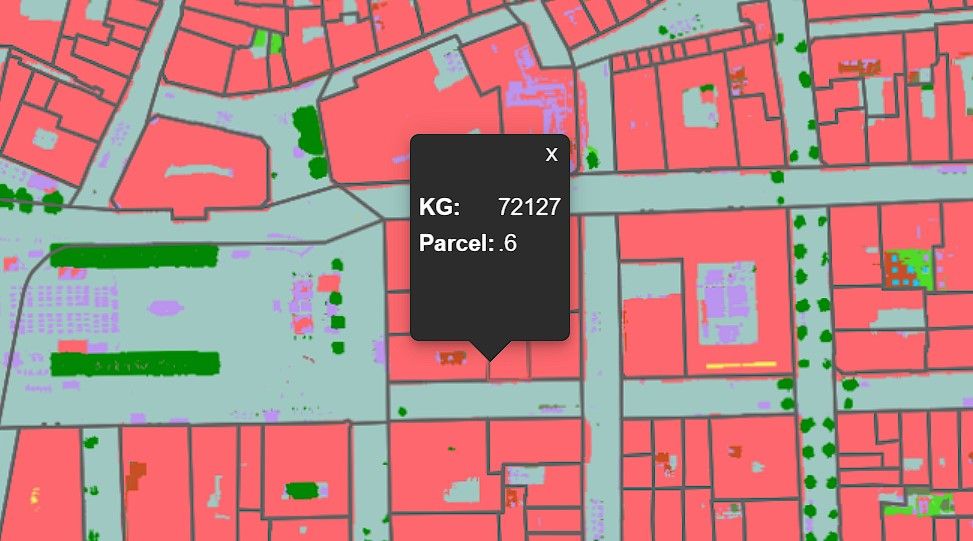
The placeholders in the format {ENTITY.xxx} will be replaced on the client with the values of the selected element and is visualized like that:
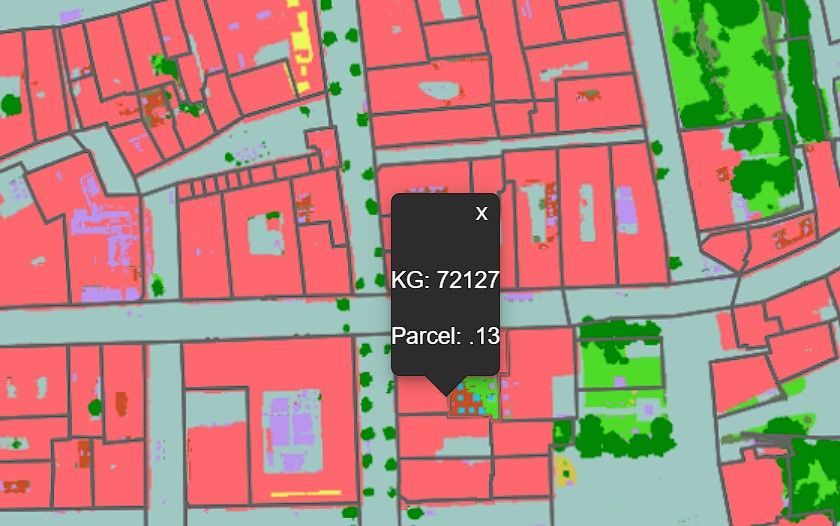
In this case the visualization would be ok as we only have to show two values. But, as we have seen above, there are a lot more columns we want to visualize for the parcel and making it visual more compelling. One option is to use the build in editor inside of the MAE Studio.
Studio Editor
Let's give it a try and create a table around our values to align them. In the MAE Studio you would see the following definition:
And we would see the following result in the client:
This is already a huge improvement and increases the readability for the user significantly. We can further improve the tooltip by removing the grid lines, using a bold font for the first column and so on by only using the editor. What do you think about this result?
HTML/CSS advanced styling
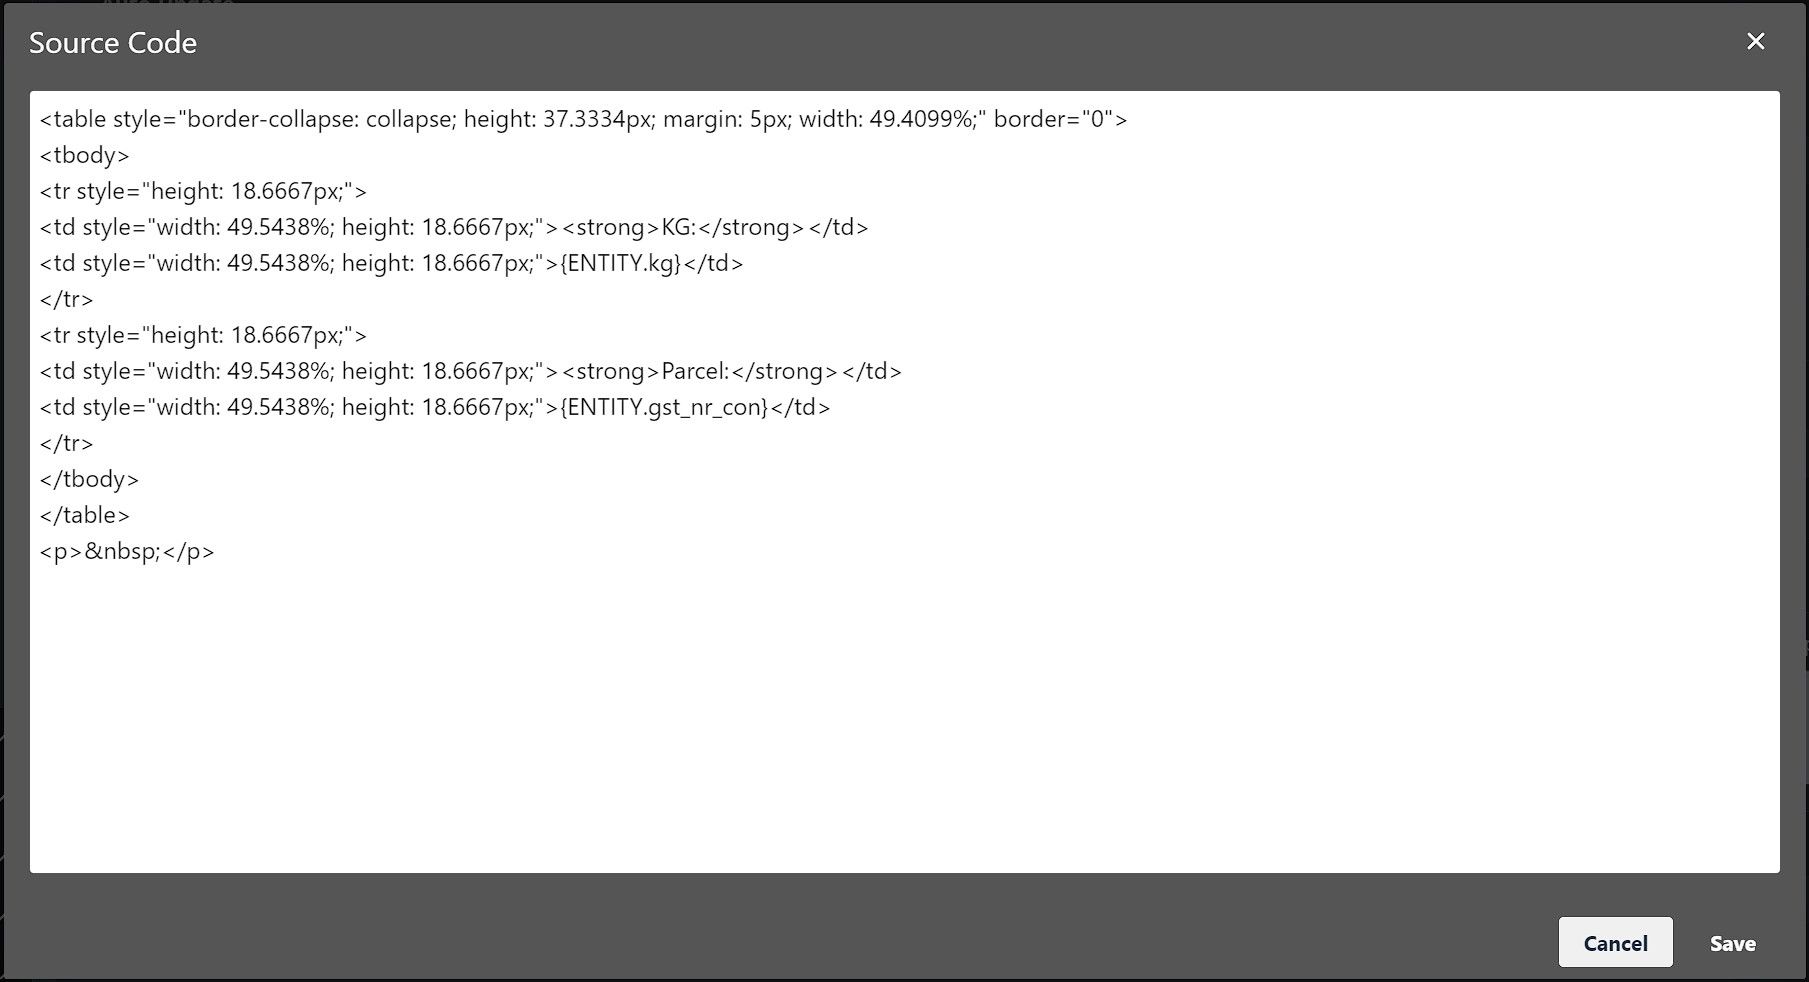
What we haven't talked about yet is the fact that the editor produces a HTML code in the background. You can see the code produced if you click on the following icon within the editor:
The code for our current tooltip would look like this:
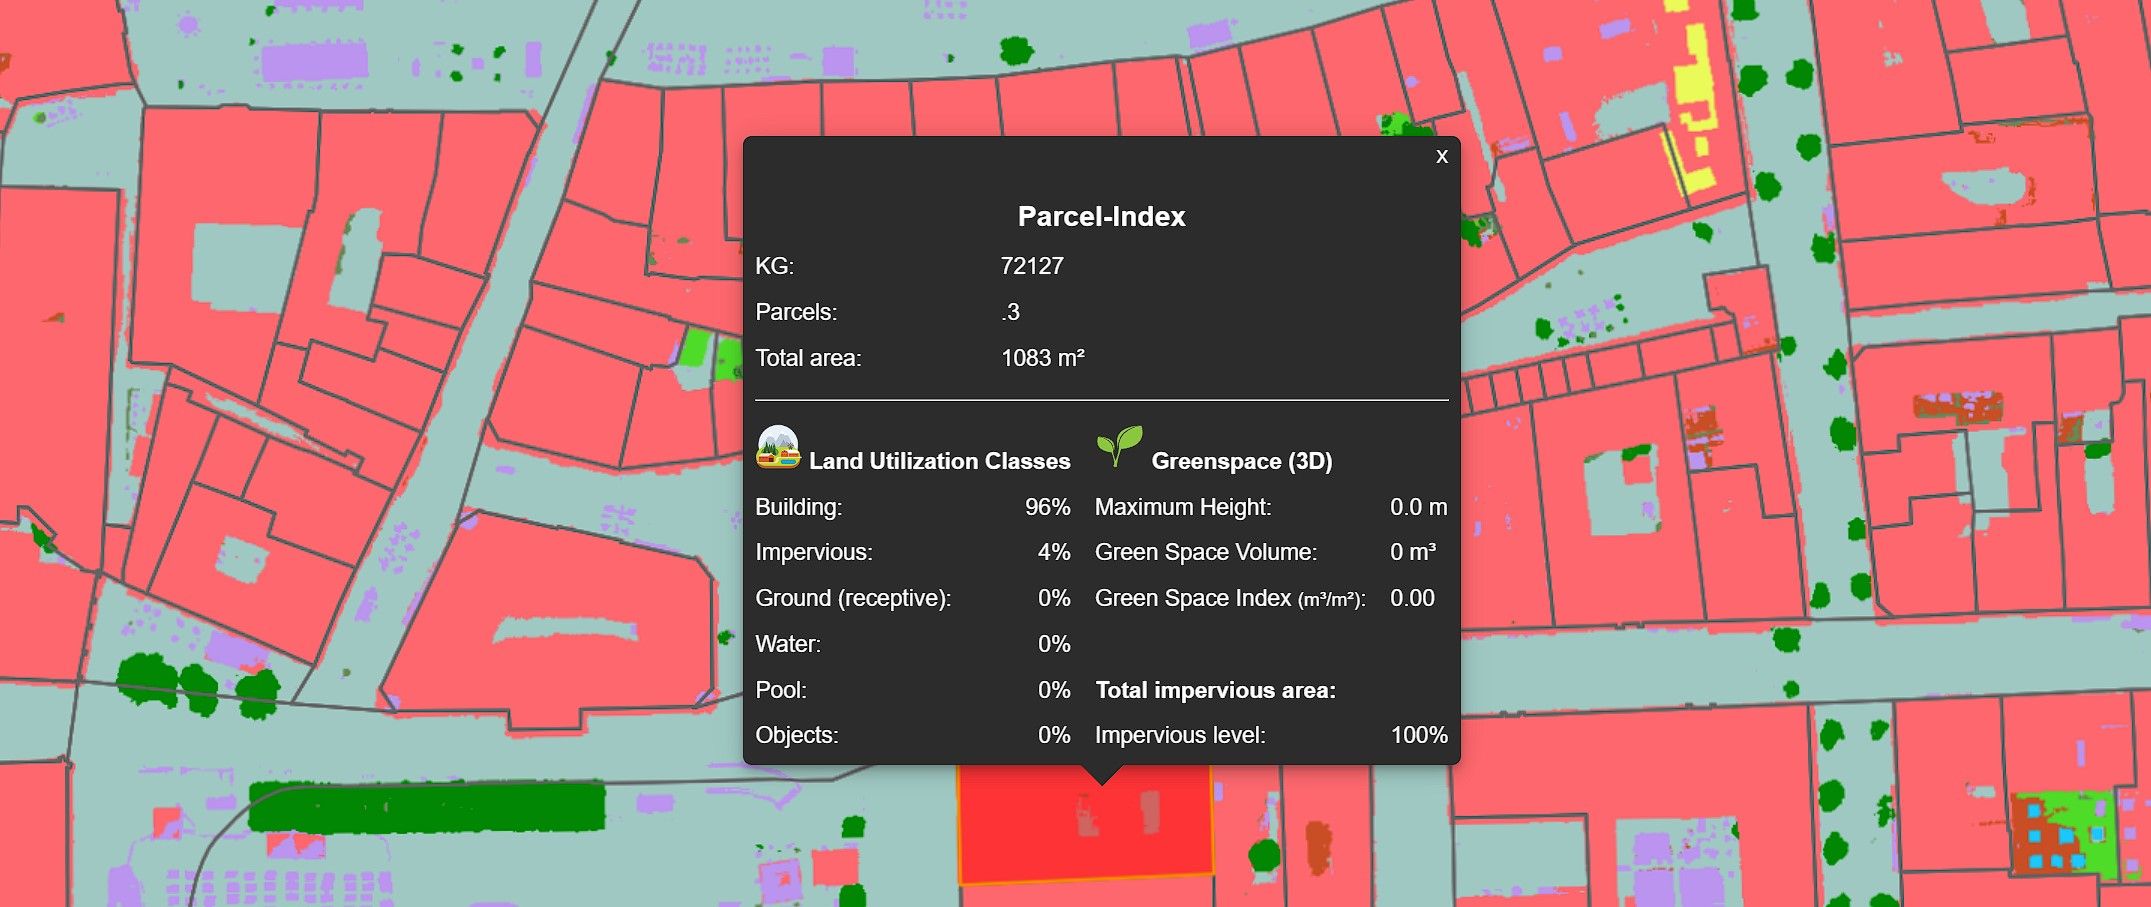
Knowing that the tooltip is HTML with CSS support we now have all the creative possibilities. We can structure the data in the way we want, add icons and images and are only limited by our imagination and creativity. Let's go back to the image of the tooltip on top of this article:
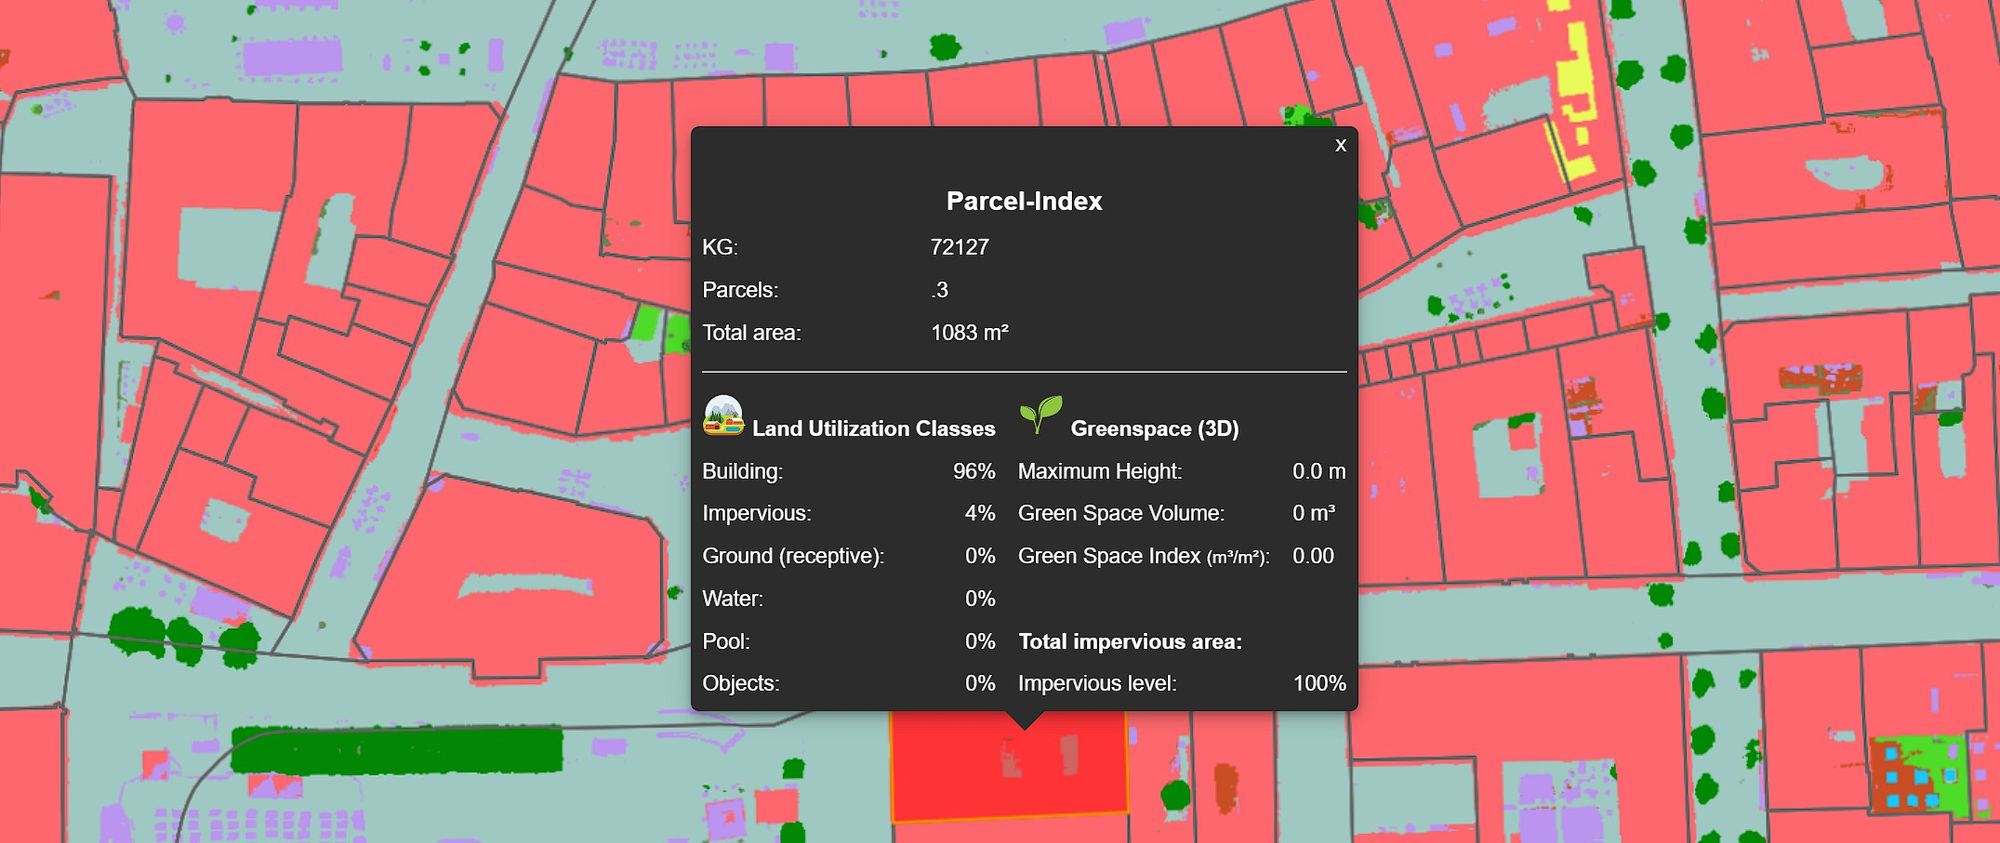
As you can see, even complex information can be visualized in an effective and readable way. Don't be scared to play around with your tooltip definition even if your HTML and CSS knowledge is limited. Already some smaller tweaks can improve your result significantly. Or take the copy from the example below as a starting point:
As you can see in the example we also used some formatting options for the numbers displayed in the tooltip. For example {ENTITY.imper_perc:##0} will round the value to an integer. There are several possibilities to format your values:
| Number format | Input | Output |
|---|---|---|
| 00000 | -1234.567 | -01235 |
| 0000.000 | -1234.567 | -1234.567 |
| ## | -1234.567 | -1235 |
| ##00 | 0 | 00 |
| .00 | -0.123 | -.12 |
| 0.00 | -0.123 | -0.12 |
| #.# | -1234.567 | -1234.6 |
| #.##### | -1234.567 | -1234.567 |
| .##### | -1234.567 | -1234.567 |
| #.000000 | -1234.567 | -1234.567000 |
| #,###,### | -1234567.890 | -1234.567,890 |
| '#'# | -1234.567 | -1,234,568 |
| 'text'# | -1234.567 | -#1235 |
| yyyy-MM-dd HH:mm:ss | 20220805110000 | 2022-08-05 11:00:00 |
Conclusion: Creating beautiful and structured tooltips in M.App Enterprise is easy. Already the build in editor provides you a rich set of formatting options to visually enhance your tooltips.