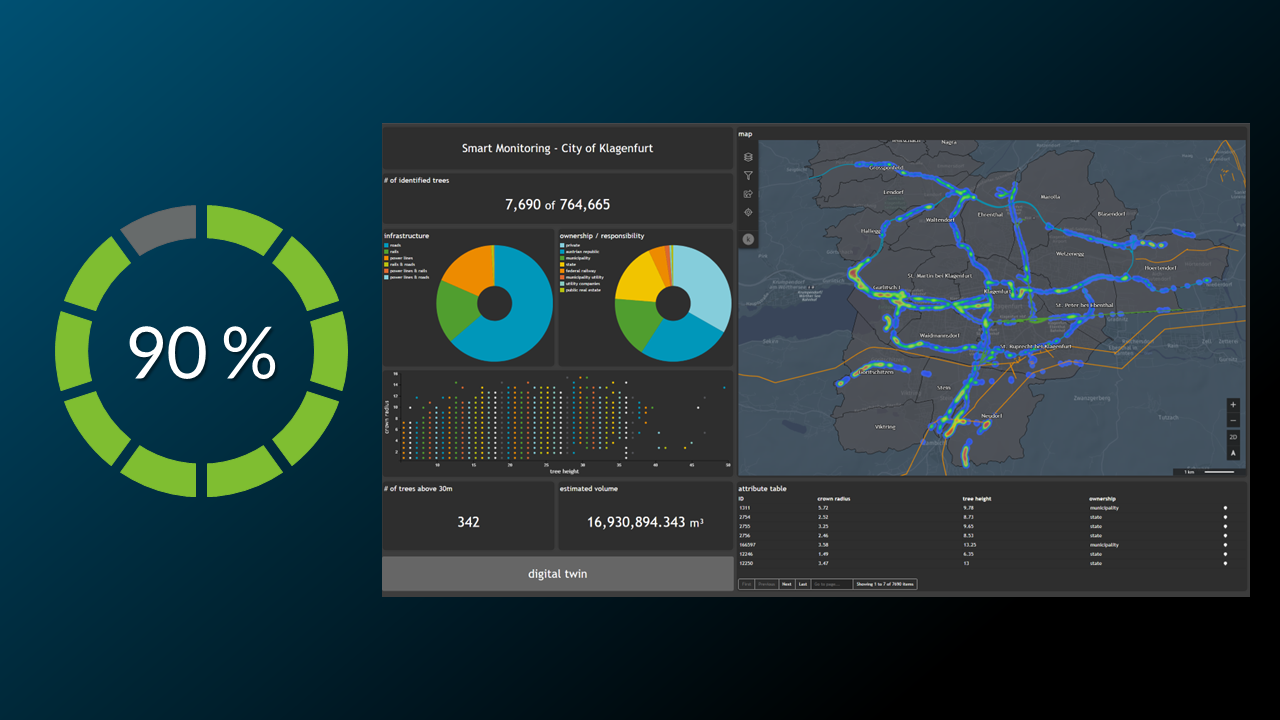
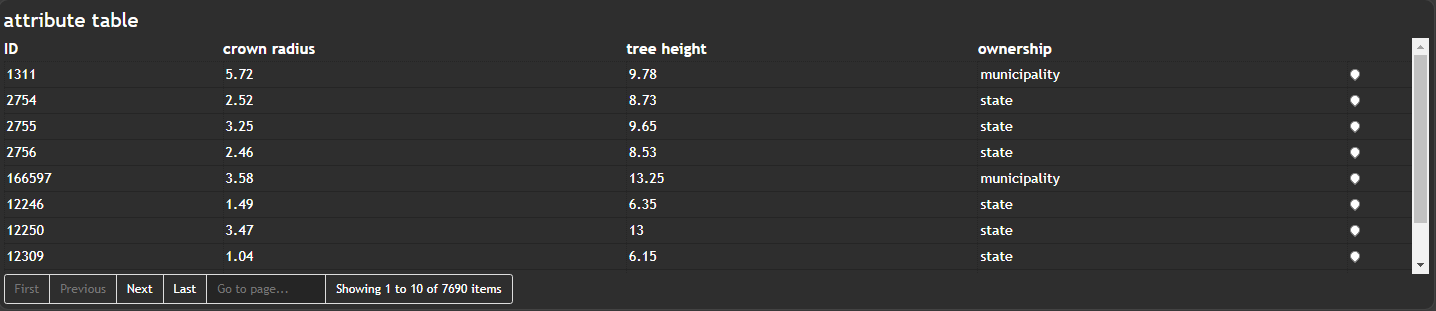
The result of this tutorial is to create the following Data table widget
We want to show all necessary settings in order to achieve that. Every needed tab in the Widget configuration window is highlighted with a seperate header.
General
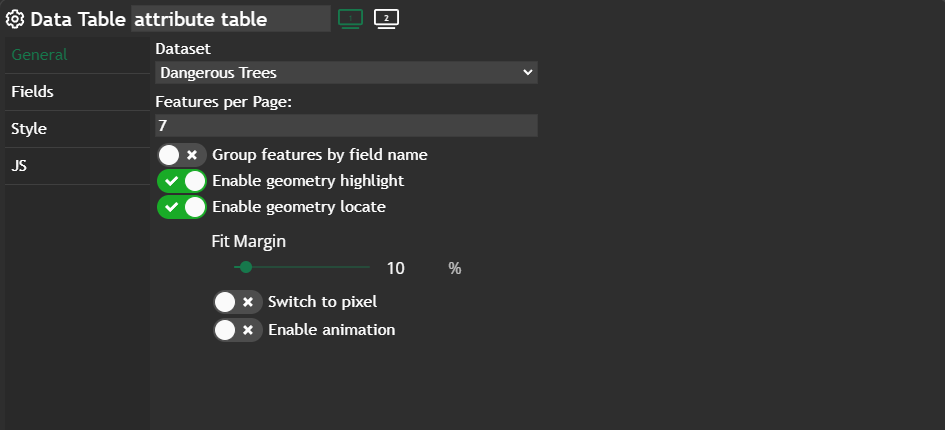
In this tab we change the Chart title to attribute table and change the Features per Page to 7. We also use the slider Enable geoemtry highlight and Enable geometry locate, which allows us to zoom to a single entry and highlight this geometry in the map.
Fields
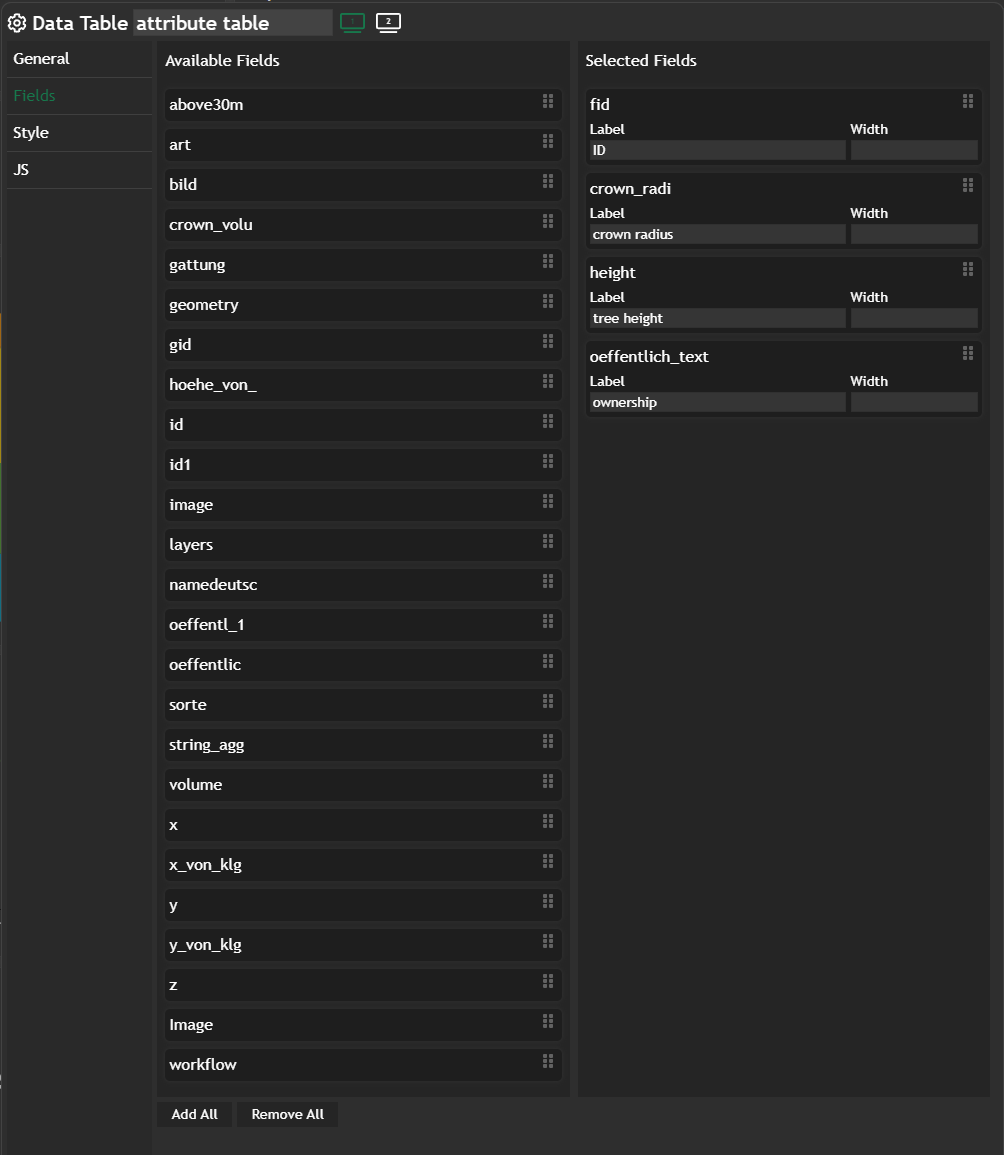
In this tab we have to define, which columns = Fields should be visible in the Data table. On the left side we have all Available Fields and with drag & drop we move the desired fields to the right side (Selected Fields) and change the Label.
Style
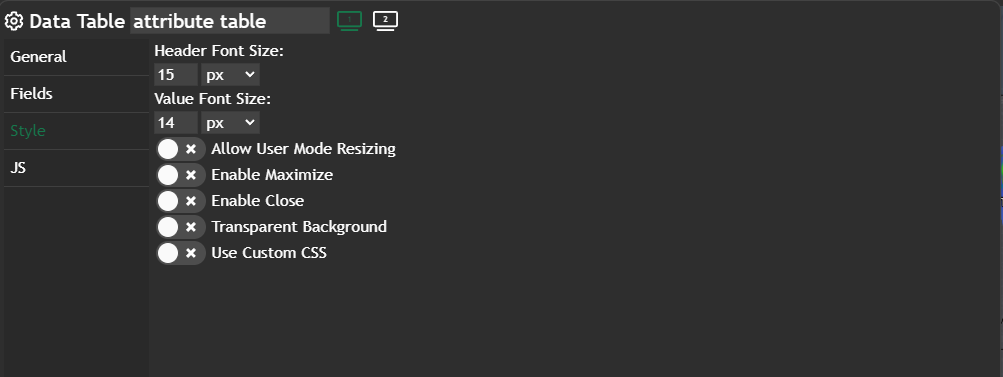
For better readability we increase the Header Font Size and the Value Font Size.
Further information
If you need further information about this kind of widget, please visit the following link.
 Marina Lanxinger