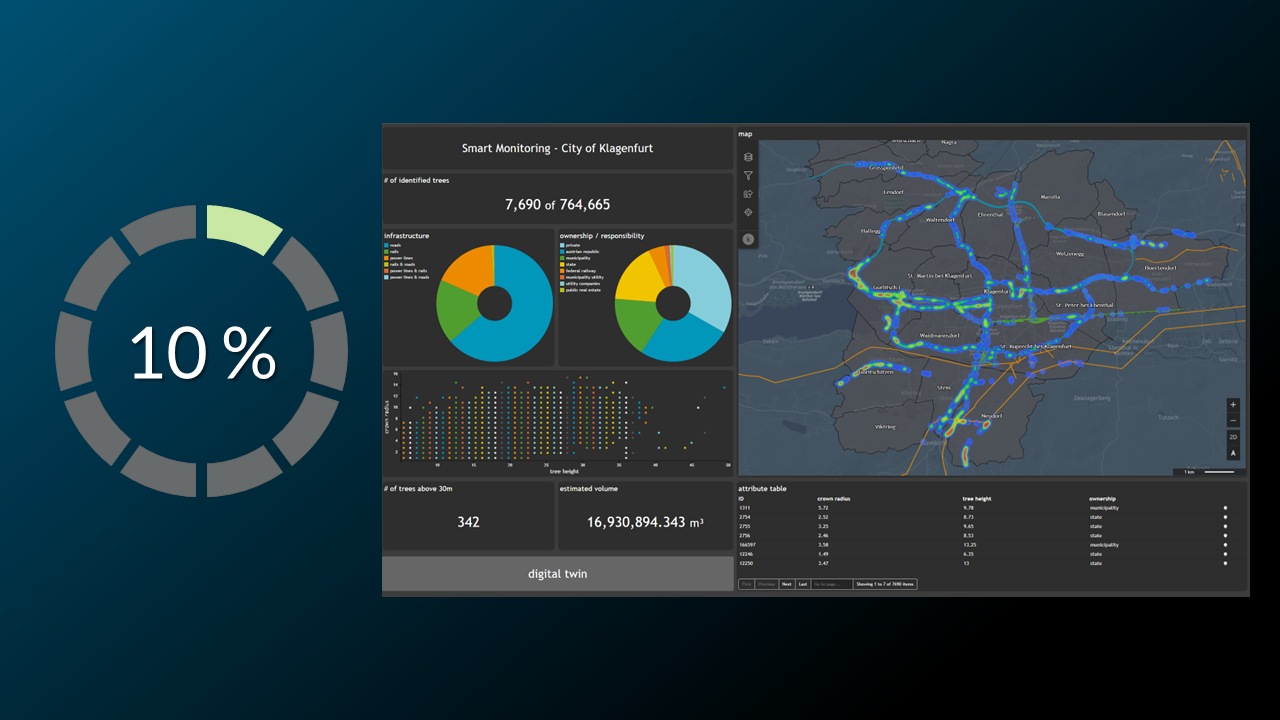
The result of this tutorial is to create the following HTML widget
We want to show all necessary settings in order to achieve that. Every needed tab in the
Widget configuration window is highlighted with a seperate header.
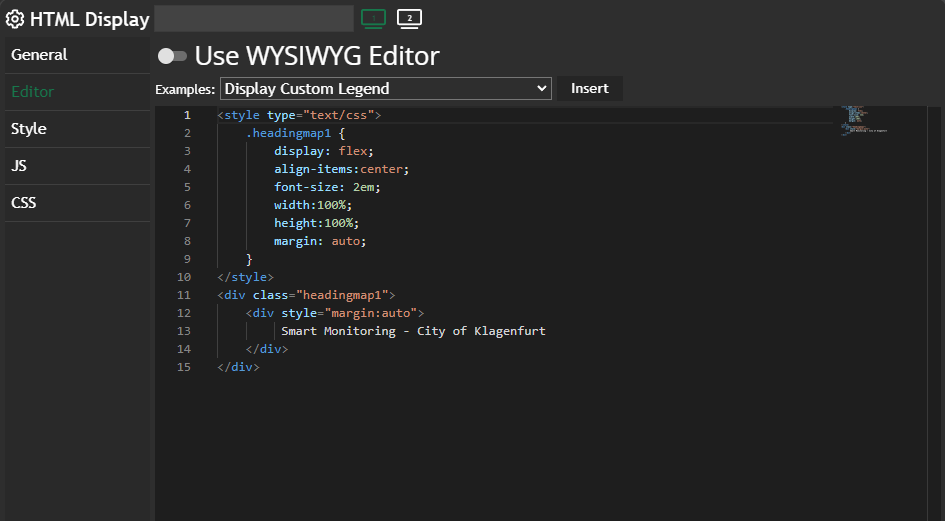
Editor
If you don't use theWhatYouSeeIsWhatYouGet (WYSIWYG) Editor, you will get a full-blown code editor with autocomplete and Intellisense.
We define some CSS / HTML and the corresponding "header" is just plain text within the construct and NOT as a chart name, which would misplace the text in the widget.
Further information
If you need further information about this kind of widget, please visit the following link
Number & HTML display
This content post will revolve around both number and HTML display charts, as they are very similar to each other. ⚠️
The Number Display chart is read-only and serves as a valuable resource for presenting data in a clear and concise manner. It allows you to showcase data reports, averages, or
 Marina Lanxinger