Style Wizards
Style wizards support you to get automatically eye-pleasing styles based on attributes of the vector data. It is designated for the categorization of attributes and offers two options.
Content → Stylesets → Generate
To use a style wizard, navigate to stylesets in the content menu of M.App Studio and click on the Generate dropdown in the top panel of Style Editor.

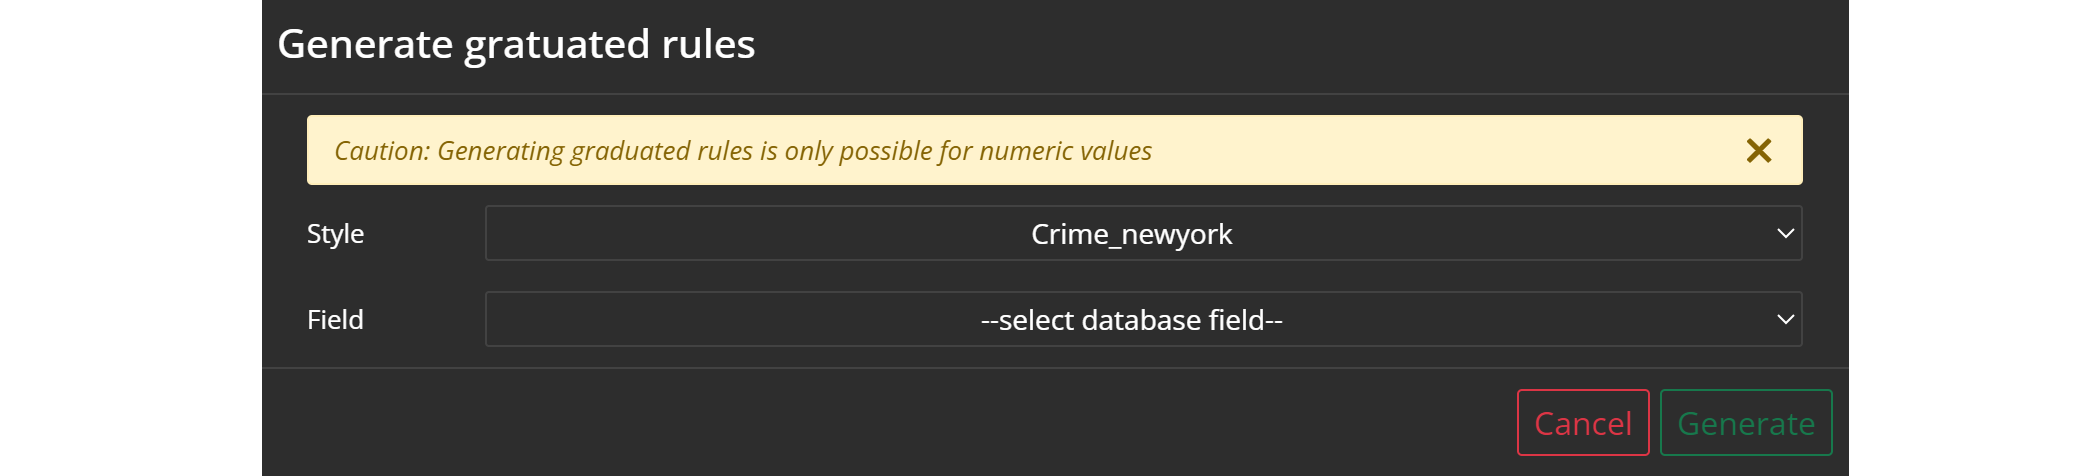
Choose either categorize or graduate based on how you want to display your categories. In any case you will be forwarded to the window below where you can already choose the desired dataset and attribute field. This step allows for a default style generation.
Categorize
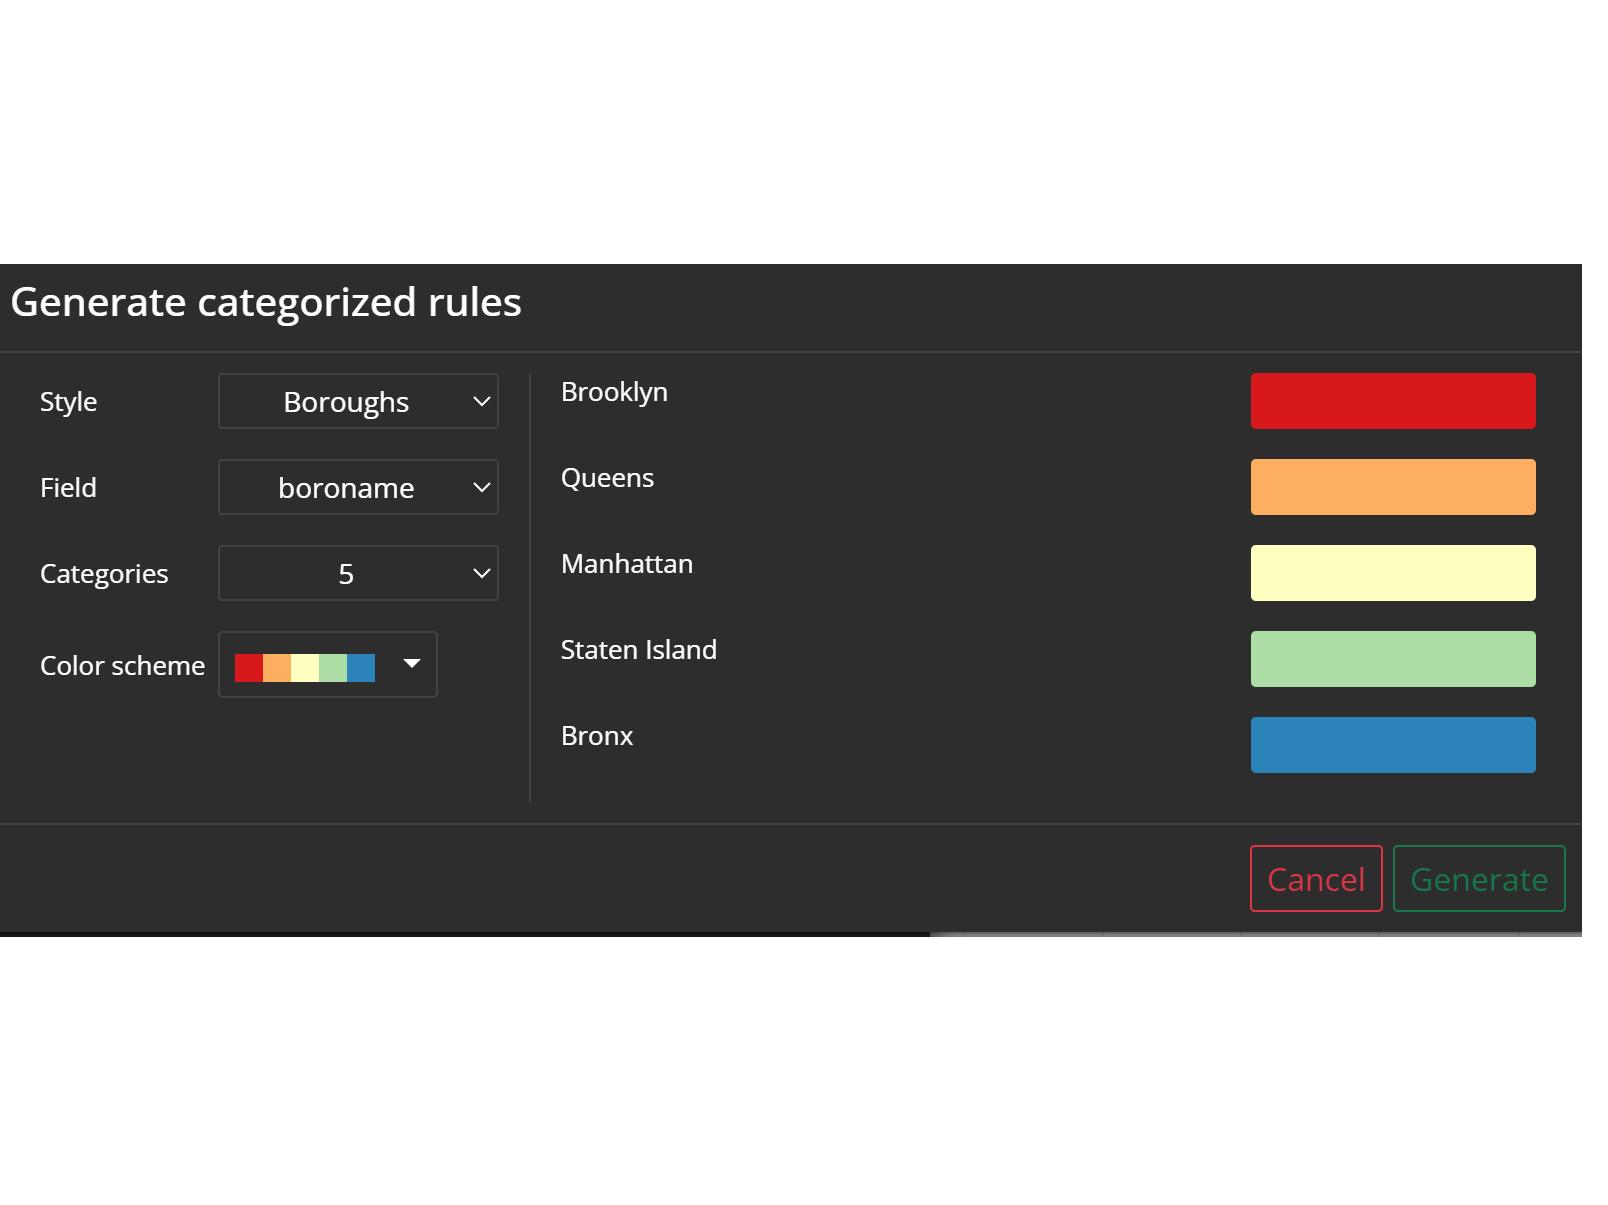
Categorized classification can be used for attributes whose values repeat, like landcover. The values can either be numeric or alphanumeric.
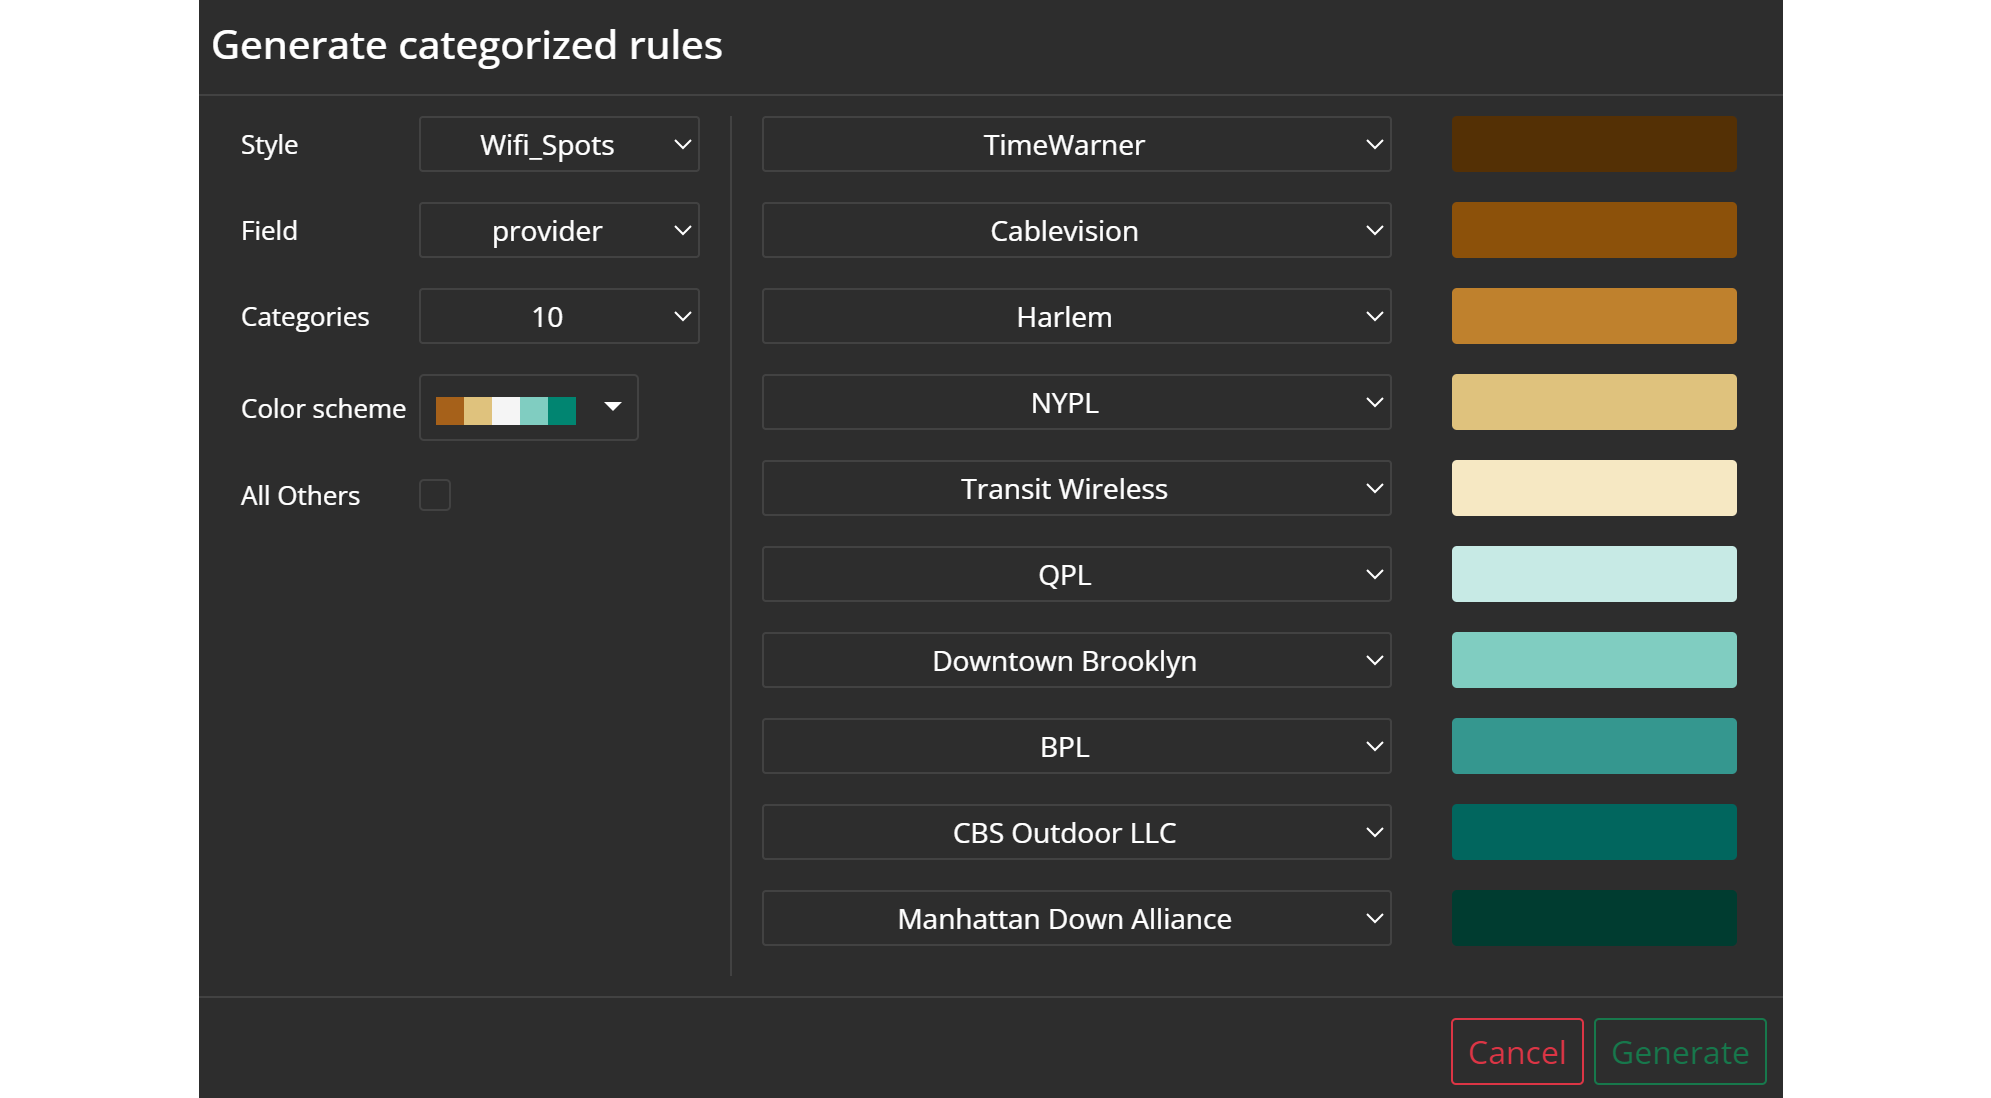
By default, the wizard creates a style with up to 10 categories, like in the example above. However, you can edit the settings.
Style: Choose the desired datasetField: Pick an associated attribute from your datasetCategories: Up to 10 categories can be selected depending on your data values. It is possible to exclude values by putting down the categories' number and choosing the desired values in the dropdown list on the right. In case your attribute values exceed 10, you can check the box sayingAll Others, which adds all existing values.Color scheme: Select the preferred color scheme for your categories. Subsequent color changes are possible at any time manually in style editor.
Graduate
Graduate styling is designated for numeric values and it categorizes value ranges from lowest to highest. As in the example below, you can see that the color values change linearly with the value range.
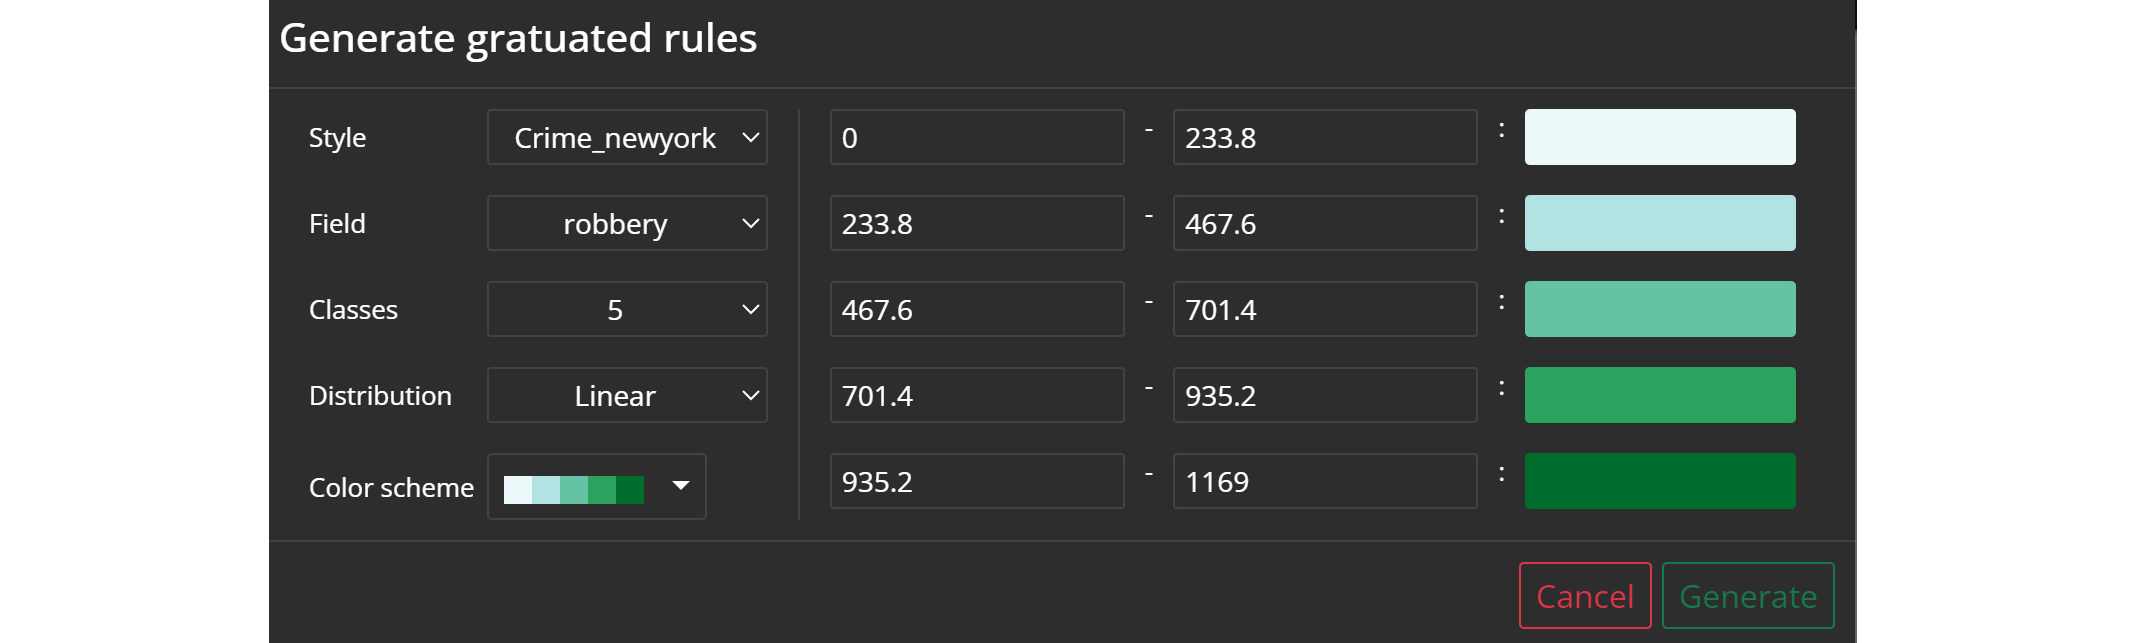
Style: Choose a datasetField: Decide which attribute you want to display in your M.App. Note that only numeric fields are shown there.Classes: The classes define the number of value ranges, in the example there are 5 in total. The minimum is 3 and the maximum is 9 classes.Distribution: The distribution indicates the intervals of the categories. Linear would mean equal intervals for example.Color scheme: Choose one of the predefined color schemes. Subsequent color changes are possible at any time manually in style editor.
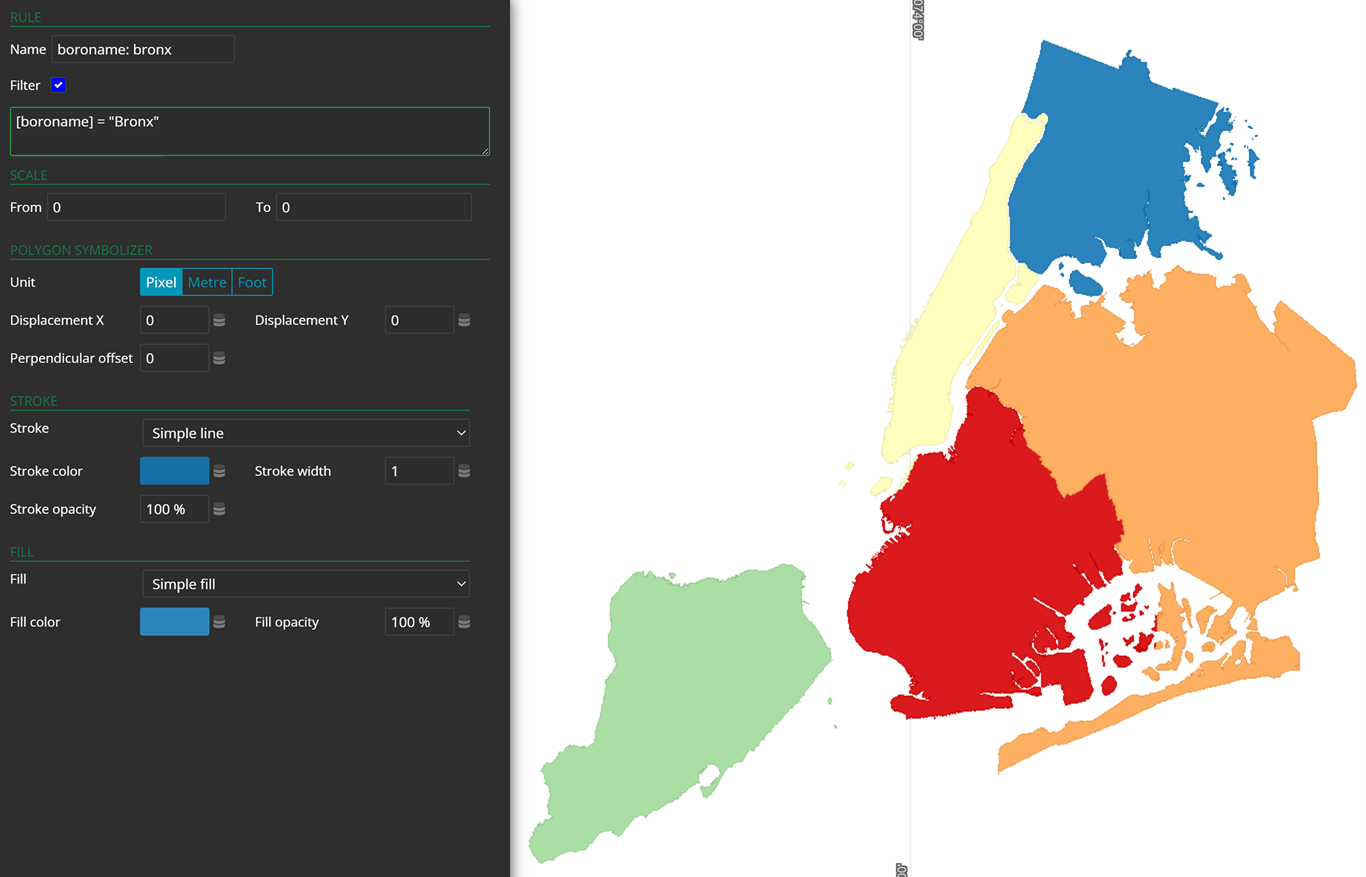
Example
When you click on generate on either style wizard mask, the classification style is applied and shown in the map preview on the right which is identical with the actual map view in your Application.