Tooltips
This tutorial will revolve around the basic settings for tooltips and the usage of tooltips in different applications.
What are tooltips?
Tooltips are small windows of information that appear when you hover over or click on an element within a map. They offer supplementary details, such as information of some data's attributes.
Studio settings
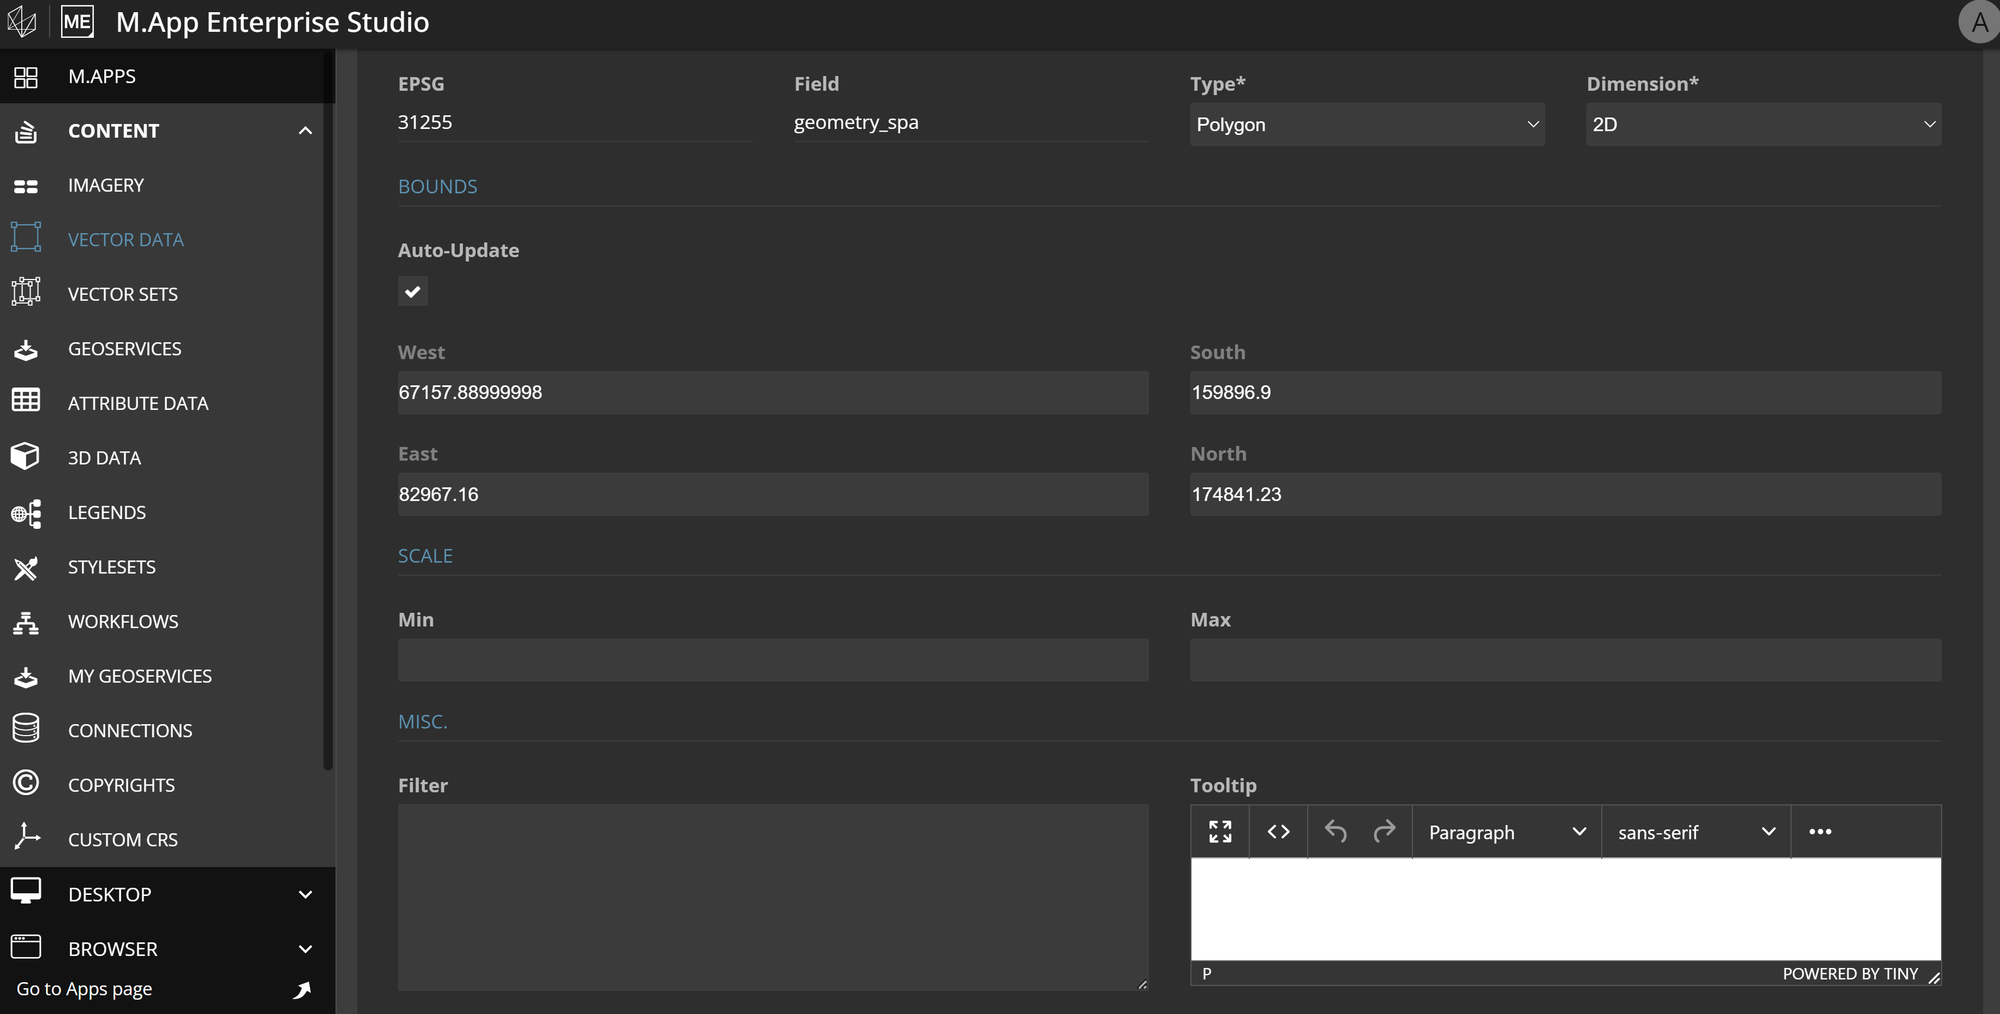
First you need to have a suitable data set with attributes that make sense as a tooltip. Go to the content menu of M.App Studio and add your vector dataset. Afterwards, search your dataset in the list of vector data and click on the edit pencil.
The vector data edit settings will open, where you can find a section called Tooltips.
Click on the first leftmost icon to display the tooltip settings in a larger window. You will find a complete configuration bar available for arranging your tooltip text and customizing its style.
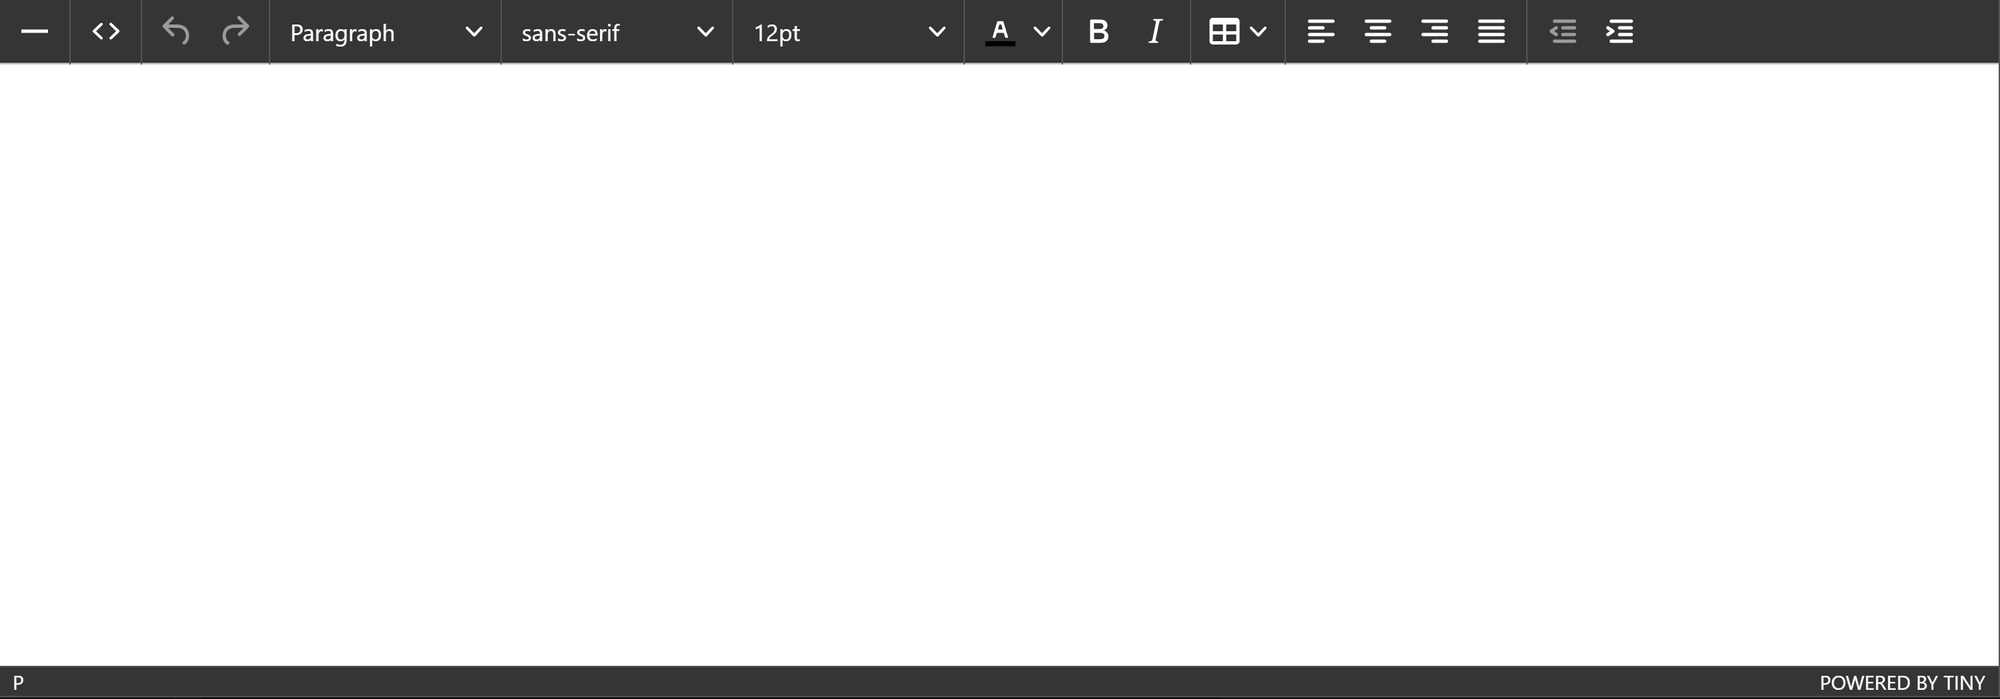
You can put any text you wish into the designated text field, which will be shown as tooltip of your layer then.
Use attributes in tooltips
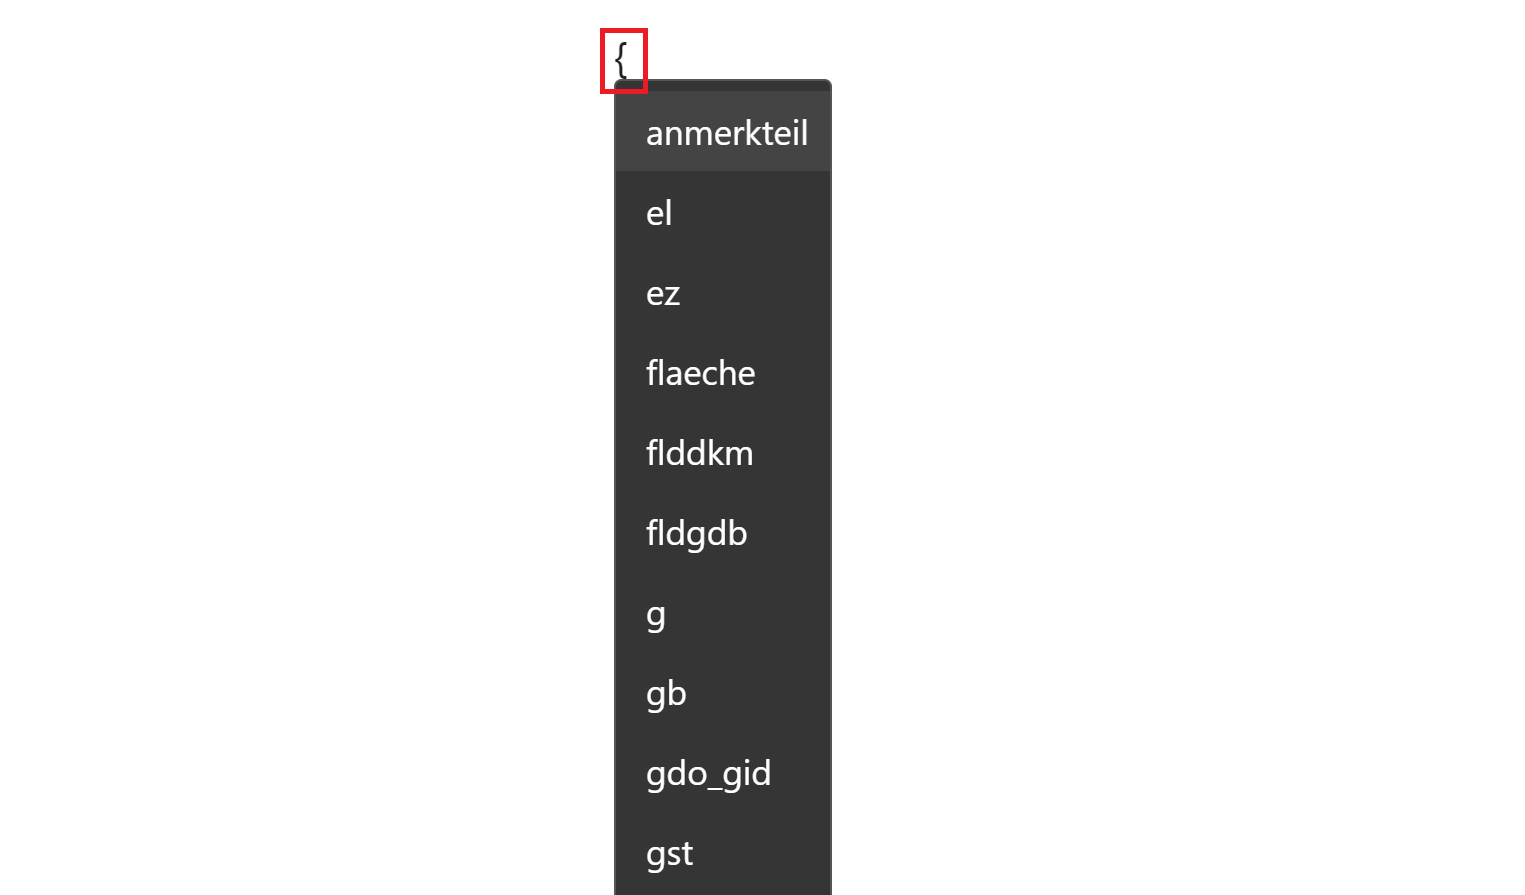
However, if you want to integrate your attribute's data information to be displayed in a tooltip, you will have to indicate the specific attribute field. This can be accomplished by typing in a curved braket. All the attributes of the layer will appear in the dropdown.
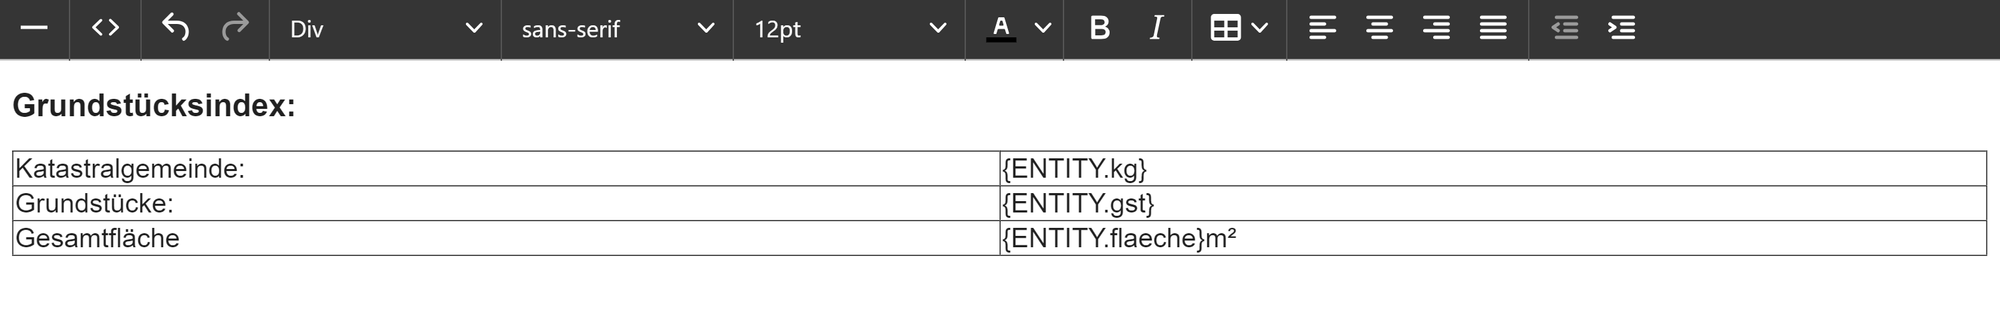
Select as many attributes as you desire, place them in different rows, or style them by using different fonts, font sizes or colors.
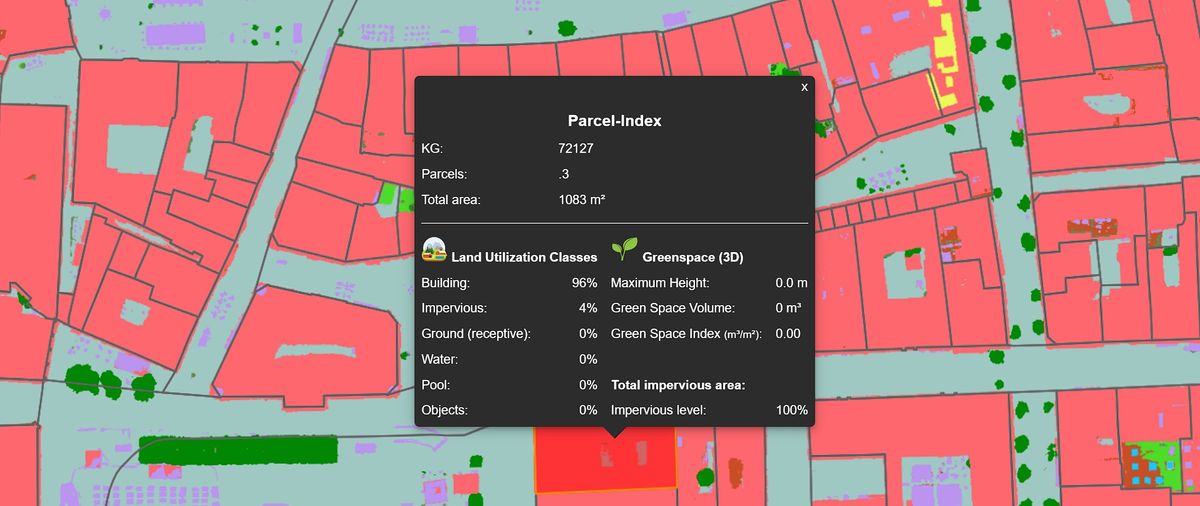
Your tooltip might look like the example below.
Adjust the HTML
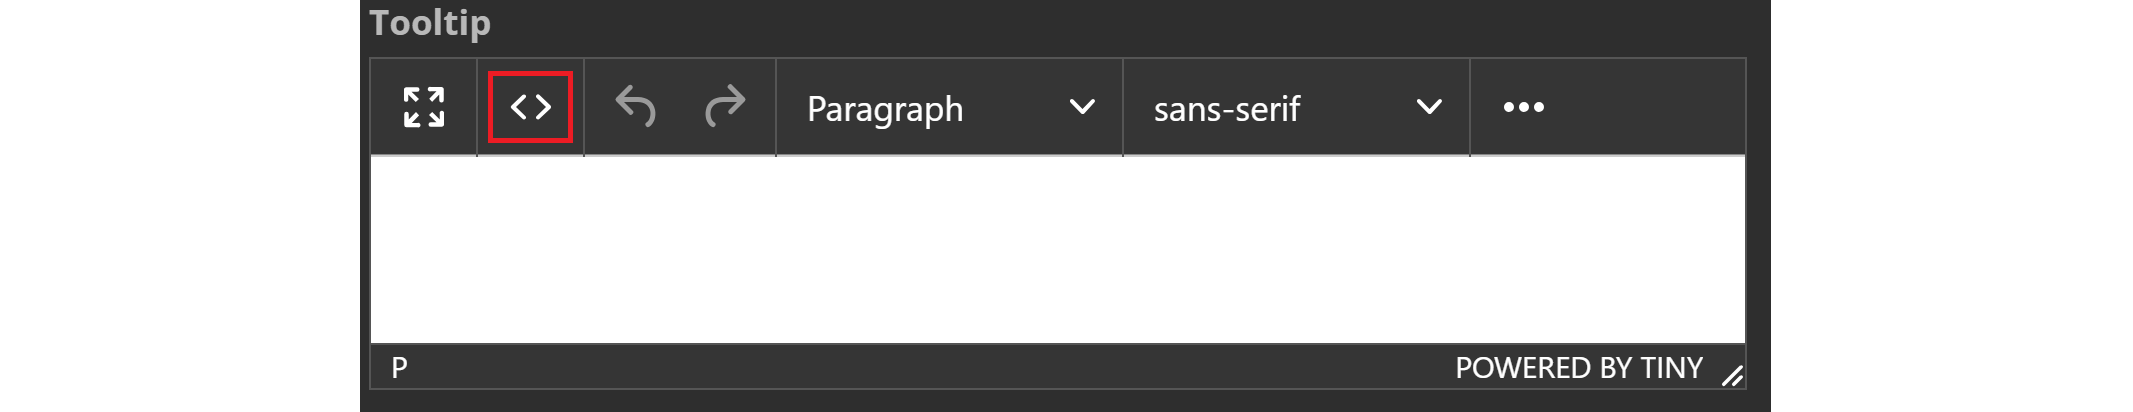
For customed solutions, it may be handy to change the hmtl behind the tooltip directly. Click on the icon with the two angle brakets to switch to the html code view.
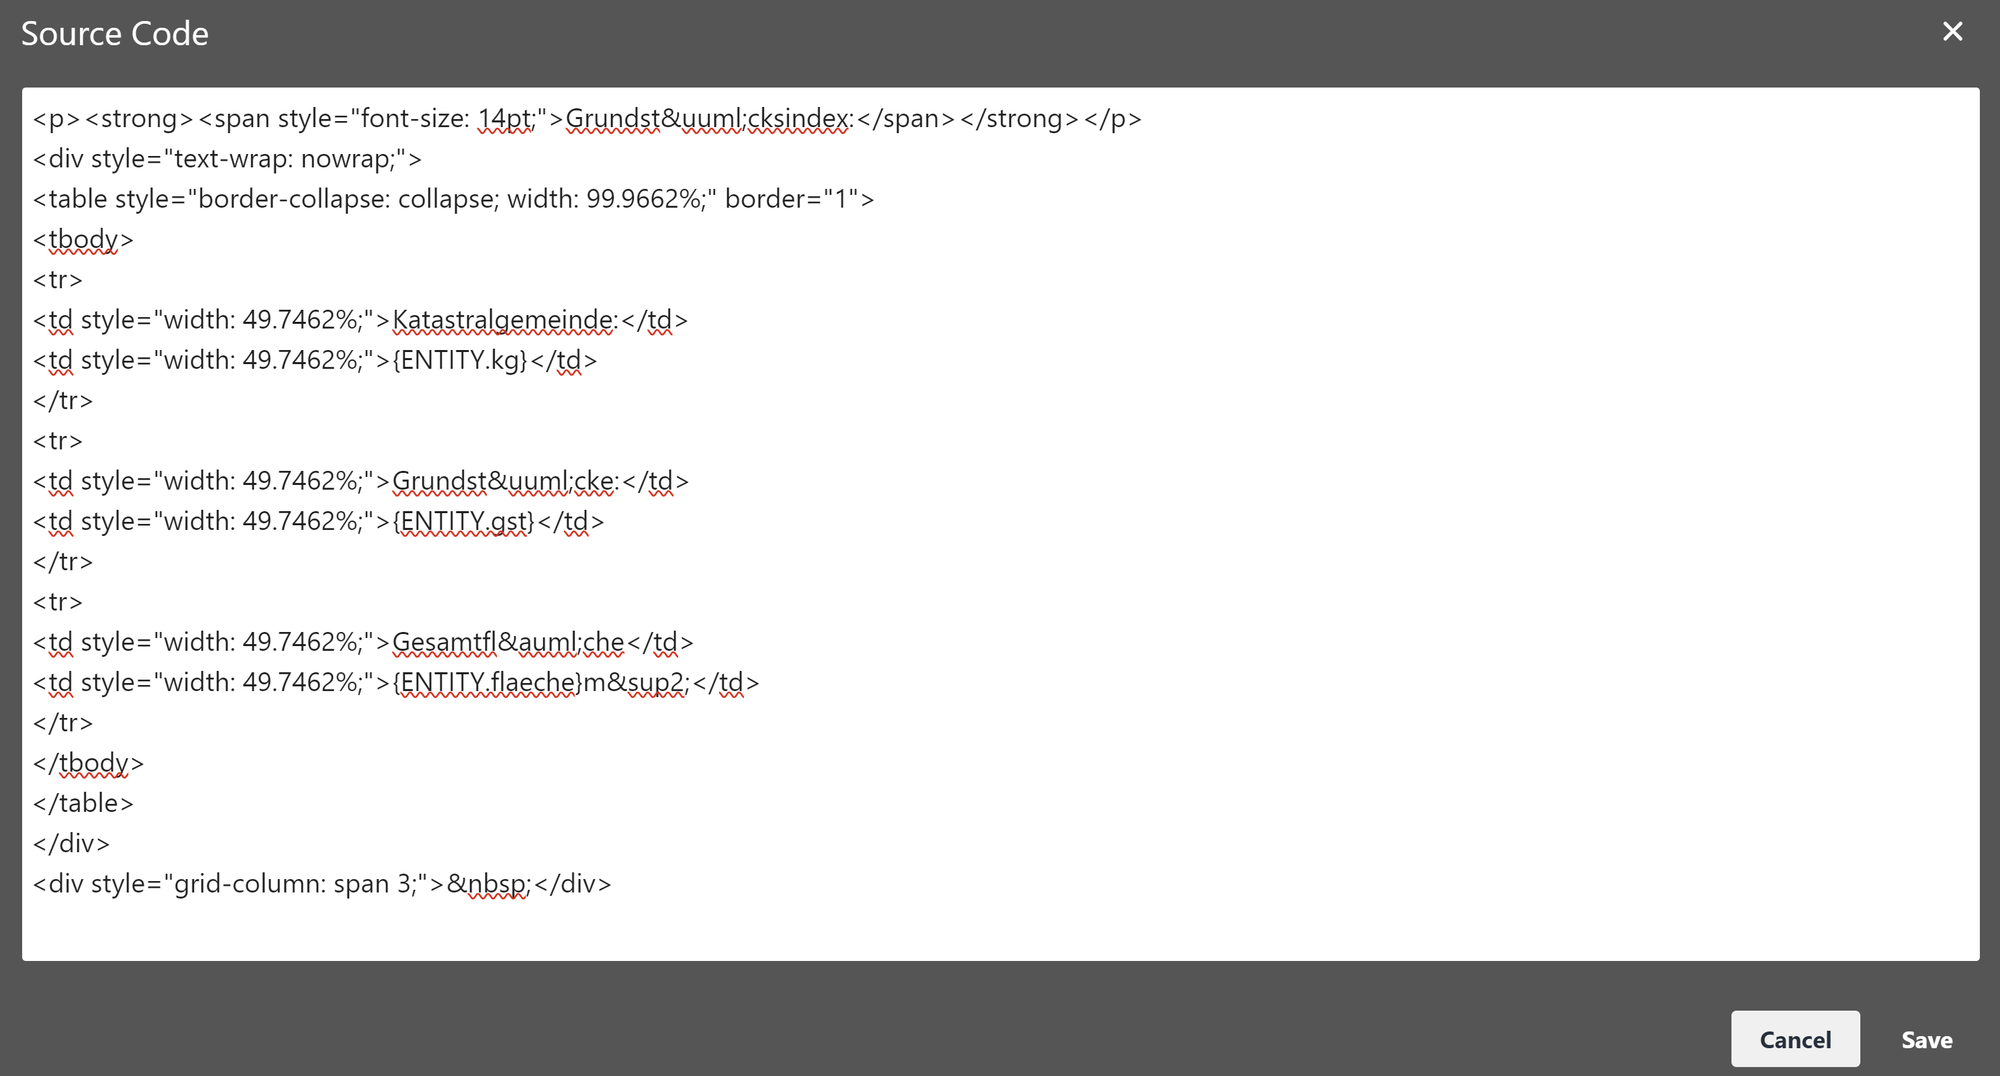
Adjust your html code to your tooltip needs and your tooltip is ready to be displayed in your Application.
Examples
A nice example, as well as guidance for a beautifully styled tooltip can be found in this post.
 Markus Holler